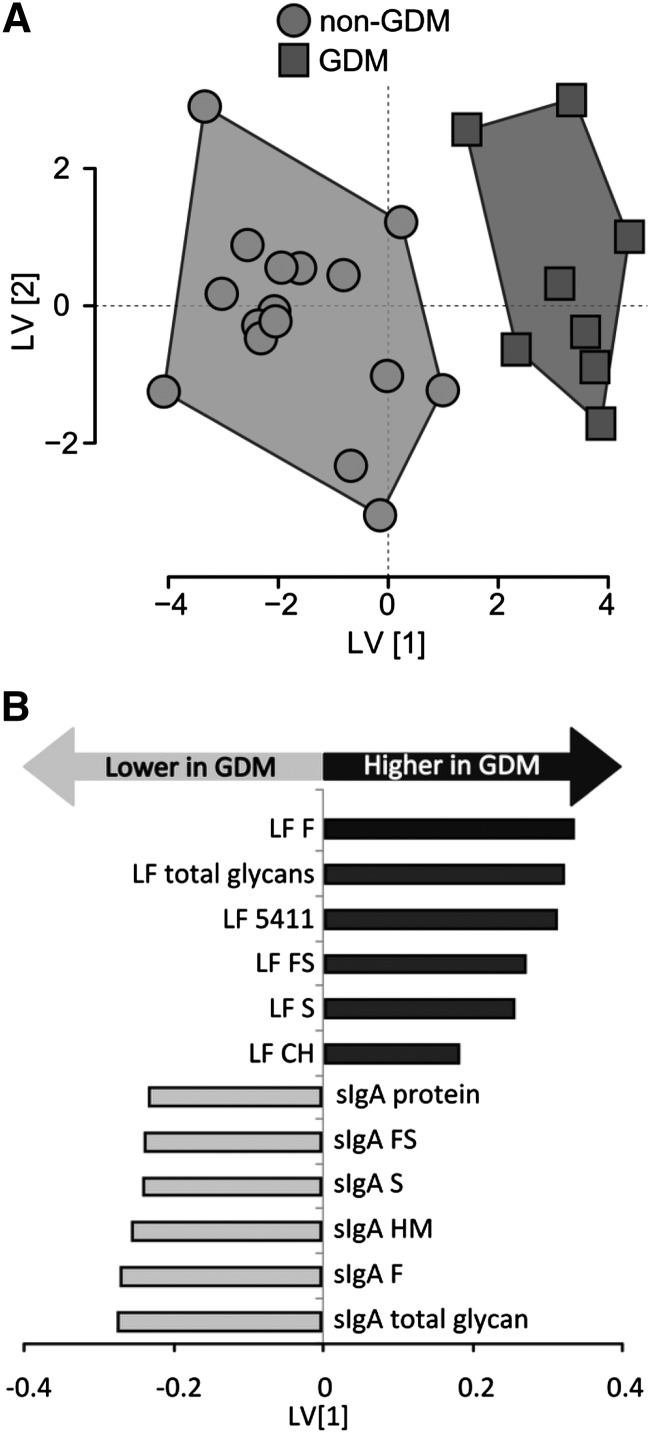
FIGURE 1.
(A) O-PLS-DA from the final model based on the 12 selected variables demonstrate clear visual separation between women with and without GDM. (B) O-PLS-DA variable loadings for the LV1 display the relative levels of milk N-glycans from women with vs. without GDM. CH, complex hybrid; F, fucose; FS, fucose and sialic acid; GDM, gestational diabetes mellitus; HM, high mannose; LF, lactoferrin; LV, latent variable; O-PLS-DA, orthogonal signal corrected partial least-squares discriminant analysis; S, sialic acid; sIgA, secretory IgA; 5411, N-glycan containing 5 hexoses, 4 N-acetyl-hexosamines, 1 fucose, 1 sialic acid.

