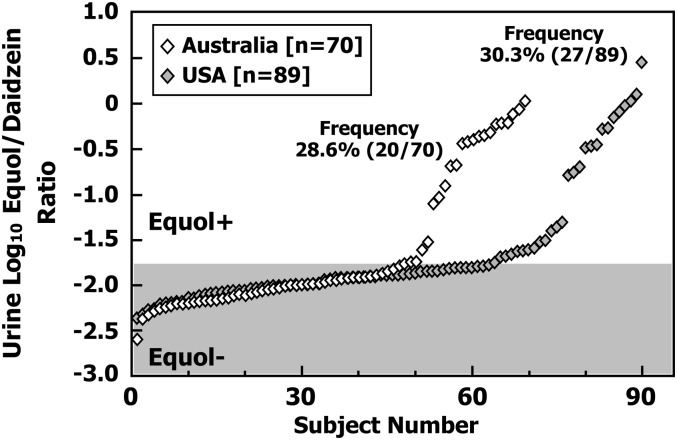
FIGURE 1.
Log10-transformed urinary S-(-)equol:daidzein ratios in rank order of the individual participants grouped according to study site, Australia (n = 70) and United States (n = 89). Points falling in the shaded area were classified as non–equol producers and those in the unshaded area were classified as equol producers. Equol+, equol producer; Equol−, non–equol producer.

