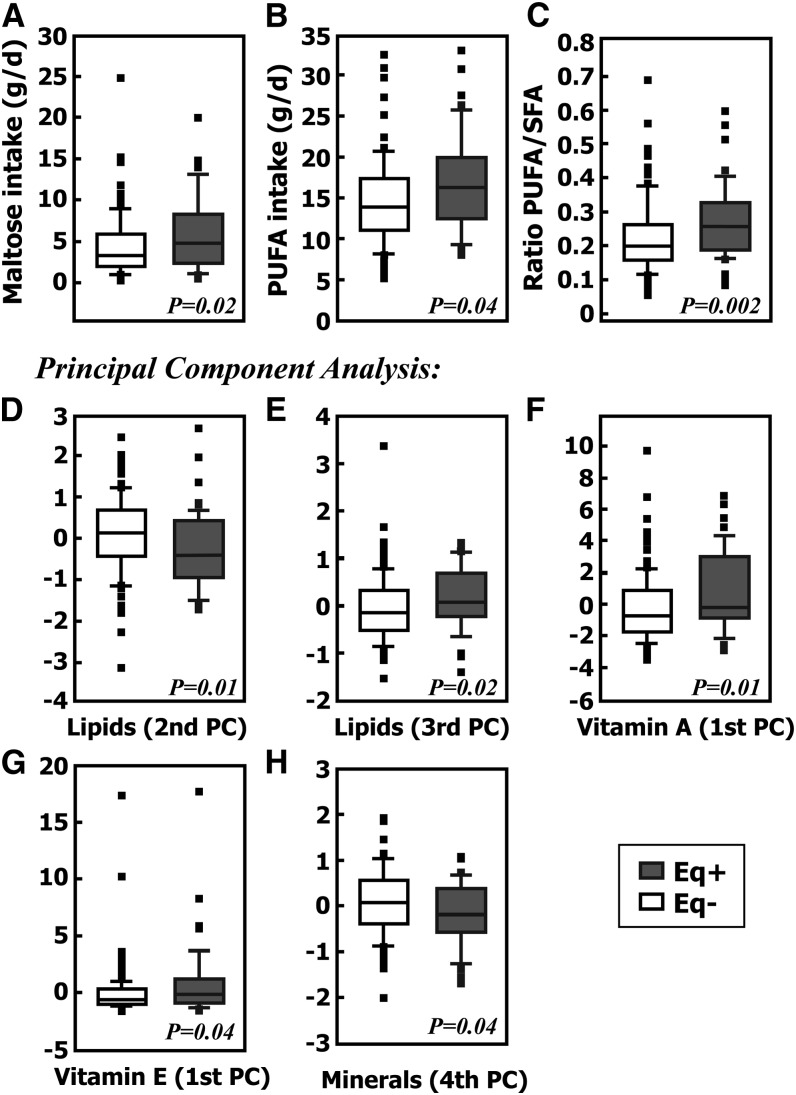
FIGURE 2.
Box-plots for study 1 comparing equol producers (n = 47) and non–equol producers (n = 109) for individual nutrients or PCs of specific macromolecular categories that demonstrated significance at P < 0.05. For PCs, positive values indicate higher intake and negative values indicate lower intake. (A) Dietary intake (g/d) of the disaccharide maltose. (B) Dietary intake of total PUFAs (g/d). (C) Ratio of PUFA:SFA intake. (D) PC representing the difference between intake of total cholesterol relative to PUFAs. (E) PC representing the difference between the intake of total cholesterol and PUFAs relative to SFAs. (F) PC representing weighted mean of vitamin A components. (G) PC representing weighted mean of total α-tocopherol, vitamin E components. (H) PC representing weighted sum of copper, sodium, and manganese relative to the intake of calcium. The shaded boxes represent equol producers and the white boxes represent non–equol producers. The line in the middle of the box represents the median or 50th percentile of the data and the box extends from the 25th to the 75th percentile. The lines emerging from the box extend to the upper and lower adjacent values, i.e., the largest data point ≤75th percentile plus 1.5 times the IQR and the smallest data point ≥25th percentile minus 1.5 times the IQR, respectively. If the examined data come from a normal distribution, one would expect the interval between the adjacent values to include 99.3% of the data. Observed points more extreme than the upper or lower adjacent values, if any, are individually plotted. Eq+, equol producer; Eq−, non–equol producer; PC, principal component.

