


Figure 2.
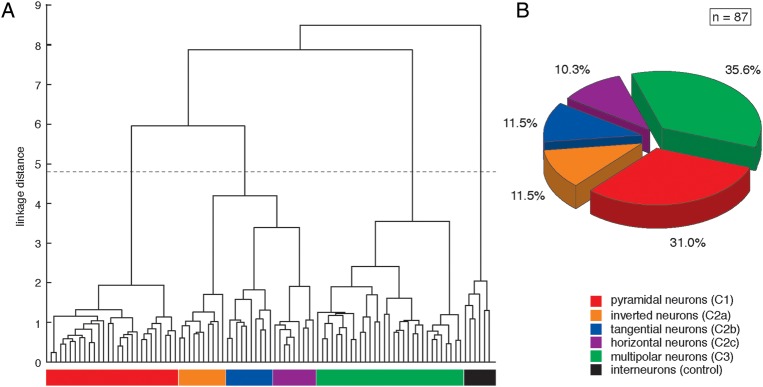
CA of L6B neurons. (A) The linkage dendrogram for the unsupervised CA of morphological and functional parameters of L6B neurons are listed in Table 1. L6B interneurons have been included in the analysis as controls and were clearly separated from the excitatory L6B neurons. The x-axis represents individual cells, and the y-axis represents the average Euclidean within-cluster linkage distance; the dashed line indicates the cutoff as determined by Thorndike's procedure (Thorndike 1953). Three distinct main clusters could be defined: (C1) neurons with a distinct apical dendrite towards the pial surface, (C2) neurons with a main “apical”-like dendrite not towards the pial surface, and (C3) multipolar neurons without any preferential orientation. Cluster C2 was further subdivided into 3 subclusters based on the orientation of the dominant “apical”-like dendrite. Five excitatory L6B neuron types were designated as C1: pyramidal neurons (red), C2a: inverted neurons (orange), C2b: “tangentially” oriented neurons (blue), C2c: “horizontally” oriented neurons (violet), and C3: multipolar neurons (green). (B) The pie chart demonstrating the percentage of each excitatory L6B cell type with 27 pyramidal neurons (31.0%), 10 inverted neurons, 10 “tangential” neurons (both 11.5%), 9 “horizontal” neurons (10.3%), and 31 multipolar neurons (35.6%).