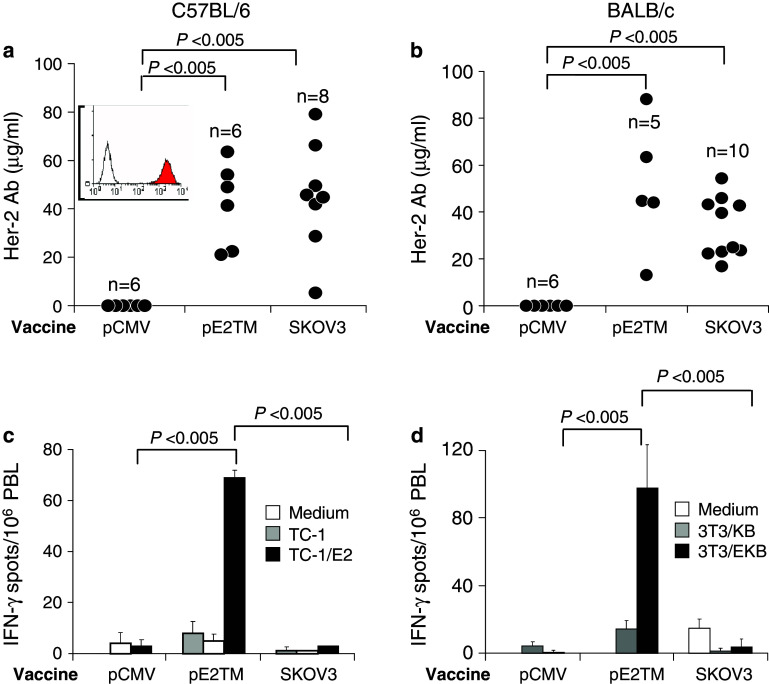
Fig. 1.
Induction of anti-Her-2 immunity by DNA versus cell vaccine in wild type mice. C57BL/6 (a, c) or BALB/c (b, d) mice were immunized twice, 2 weeks apart, by i.m. electro-vaccination with pE2TM and pGM-CSF or by i.p. injection with 2 × 10⁶ SKOV3 cells. Control mice received blank vector pCMV. The inset shows Her-2 expression on SKOV3 cells measured by anti-Her-2 mAb TA-1 (shaded histogram). Normal mouse IgG control is shown in open histogram. a, b Anti-Her-2 IgG levels in individual mice were measured by flow cytometry 2 weeks after second vaccination as described in “Materials and methods”. c, d PBL were collected 2 weeks after second vaccination and cells from each group were pooled. Her-2-specific T cells were enumerated by IFN-γ ELISPOT essay as described in “Materials and methods”

