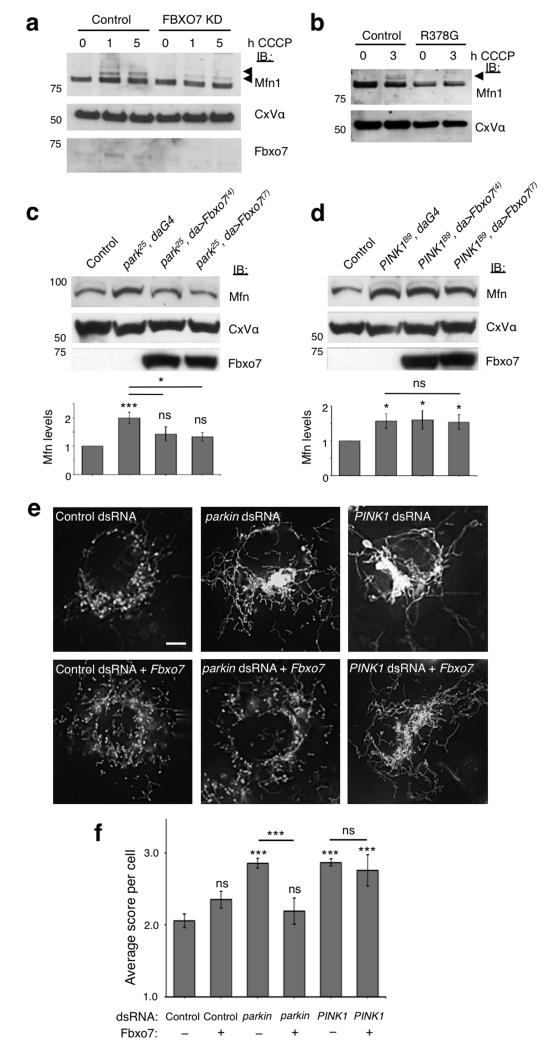
Figure 6. Fbxo7 promotes Mfn1 ubiquitination and restores Mfn levels and mitochondrial morphology in Parkin but not PINK1 deficient cells.
a-b, Ubiquitination of Mfn1 following treatment with CCCP (10 μM) is reduced in the mitochondrial fraction of both (a) SH-SY5Y cells stably expressing Fbxo7 shRNA (Fbxo7 KD) compared to an empty vector control line and (b) patient fibroblasts with homozygous R378G mutation compared to fibroblasts from healthy controls. Arrows indicate ubiquitinated Mfn1. c-d, Fbxo7 expression restores elevated Mfn steady state levels in (c) parkin but not (d) PINK1 mutant Drosophila. Histograms show mean ± S.E.M. of densitometry analysis of Mfn immunoblots above, normalised to Complex V α (CxV α). Control genotype is (c) park25/+;da-GAL4/+ and (d) PINK1B9/+;da-GAL4/+. e, Mitochondria in control Drosophila S2R+ cells stained with MitoTracker Red show a heterogeneous morphology, with a mixture of tubules and fragmented mitochondria. RNAi knockdown of parkin or PINK1 causes excessive fusion and elongated mitochondria compared to control dsRNA (C. elegans gene ZK686.3). Expression of Fbxo7 restores parkin but not PINK1 knockdown phenotype to wild type appearance. Scale bar shows 5 μm. f, Quantification of mitochondrial morphology in dsRNA treated cells. Score system; 1=fragmented, 2=wild type, 3=tubular, 4=hyper-fused (clumped). Histograms indicate mean ± S.E.M. Significance was determined by two-tailed Student t-tests (*** p < 0.001, * p < 0.05). All western blots were performed a minimum of three times and images are representative of 100 cells scored per condition. Full-length blots are presented in Supplementary Figure S9.

