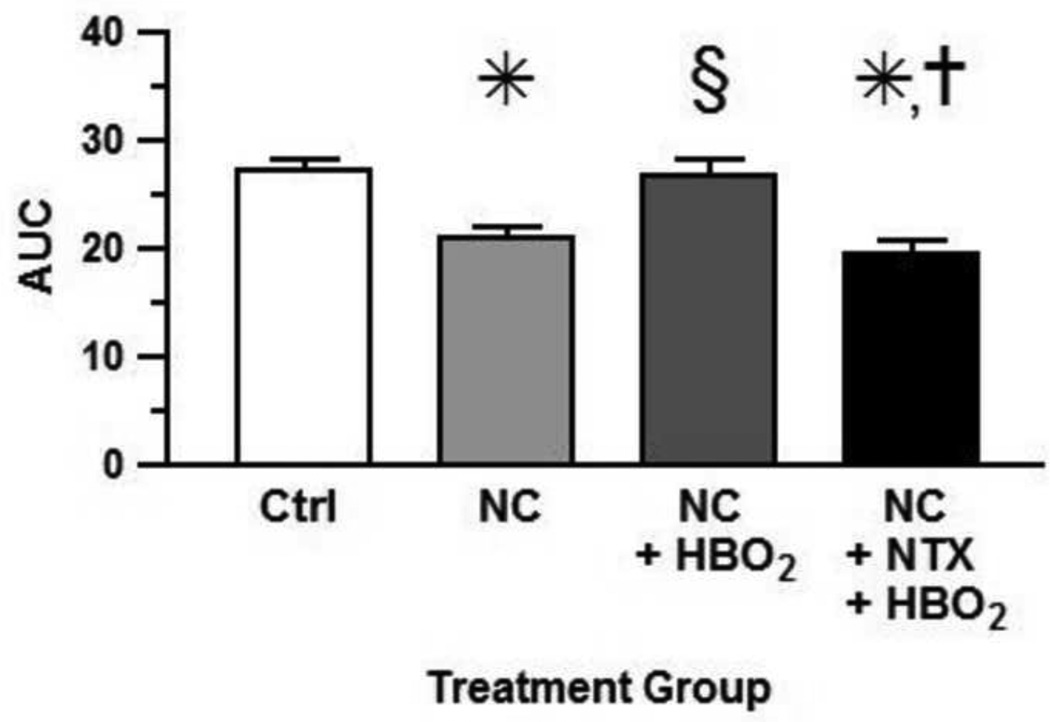
Figure 2.
AUCs of changes in mechanical threshold. Each bar represents the mean AUC and each vertical line represents the SEM of 8-9 rats per group. Significance of difference: *, P < 0.05, compared to the control group; §, P < 0.05, compared to NC group; and †, P < 0.05, compared to NC + HBO2 (one-way ANOVA and post-hoc Bonferroni's multiple comparison test).

