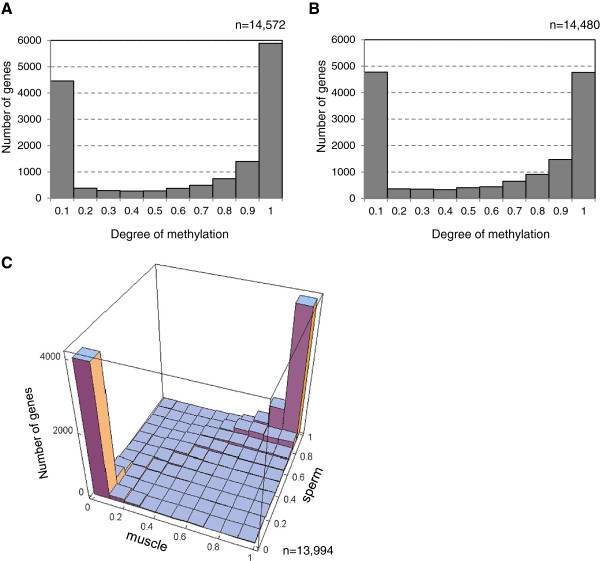
Figure 3.
Methylation degree of gene bodies in sperm and muscle. (A) Frequency of genes with varying methylation degree in sperm. Methylation degree was represented by ratio of gene region overlapped with methylated domains. (B) Frequency of genes with varying methylation degree in muscle. Methylation degree was calculated as the proportion of methylated CpG sites in the gene. (C) Joint frequency distribution of the methylation degree of genes in sperm and muscle.

