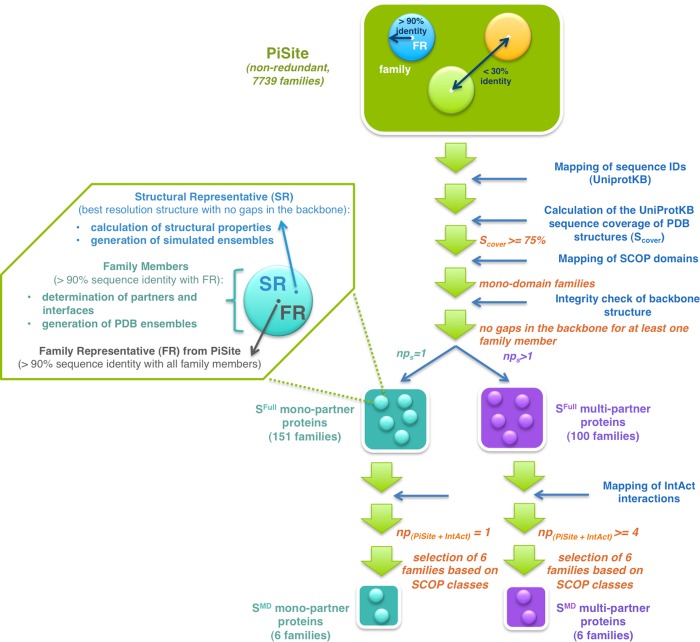
Figure 1.
Generation of SFull and SMD data sets. The flowchart shows the steps followed in the generation of the SFull and SMD data sets from the nonredundant PiSite database. The operations indicated in blue on the right were performed on all the members of each family. The applied filters are indicated in orange. The inset shows how the components of each family are defined and used. See Methods in the main text for a full description of the procedures involved.

