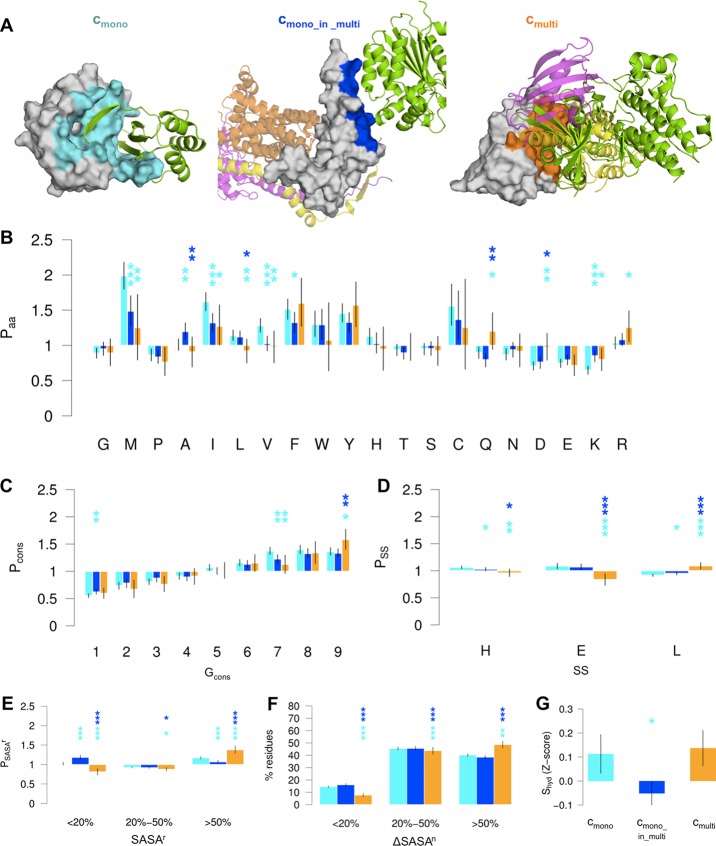
Figure 2.
Physicochemical properties of interface residues in the cmono, cmono_in_multi, and cmulti binding classes. (A) Examples of cmono (left), cmono_in_multi (middle), and cmulti (right) interfaces. The residues involved in each interface are color-mapped onto the surface in cyan (cmono), blue (cmono_in_multi), and orange (cmulti). Selected partners are represented as cartoon. Left: PDB ID 1x8d, chains D/C. Middle: PDB ID 1pp9, chains S/B. Right: PDB ID 1b6c, chains E/F. (B–E) Different types of calculated propensities relative to the surface of cmono (cyan), cmono_in_multi (blue), and cmulti (orange) residues of SFull. Error bars and significance levels were estimated with bootstrap resampling. Stars are drawn above cmono_in_multi and cmulti distributions, indicating the significance levels (*** p-value <0.001, ** 0.001 ≤ p-value <0.01, * 0.01 ≤ p-value <0.05) of the comparison with cmono (cyan) and cmono_in_multi (blue). (B) Amino acid propensity Paa. (C) Conservation propensity Pcons. The conservation is expressed as ConSurf conservation grade (Gcons, ranging from 1, less conserved, to 9, most conserved). (D) DSSP secondary structure (SS) propensity PSS. The three SS groups collect positions annotated as helix (H = “H” + “G” + “I” in the DSSP dictionary), strand (E = “E” + “B”) and loop (L = blank + “S” + “T”). (E) Relative solvent accessibility (SASAr) propensity PSASAr. Three levels of SASAr are considered, with SASAr < 20%, 20% ≤ SASAr < 50%, and SASAr ≥ 50%. (F) Fraction of SFull interface residues with a small (<20%), medium (20–50%) or large (≥50%) normalized buried SASA (ΔSASAn). The maximum ΔSASAn value is used for residues involved in more than one complex. (G) Standardized hydration score Shyd in the SMD binding classes.

