
Figure 6.
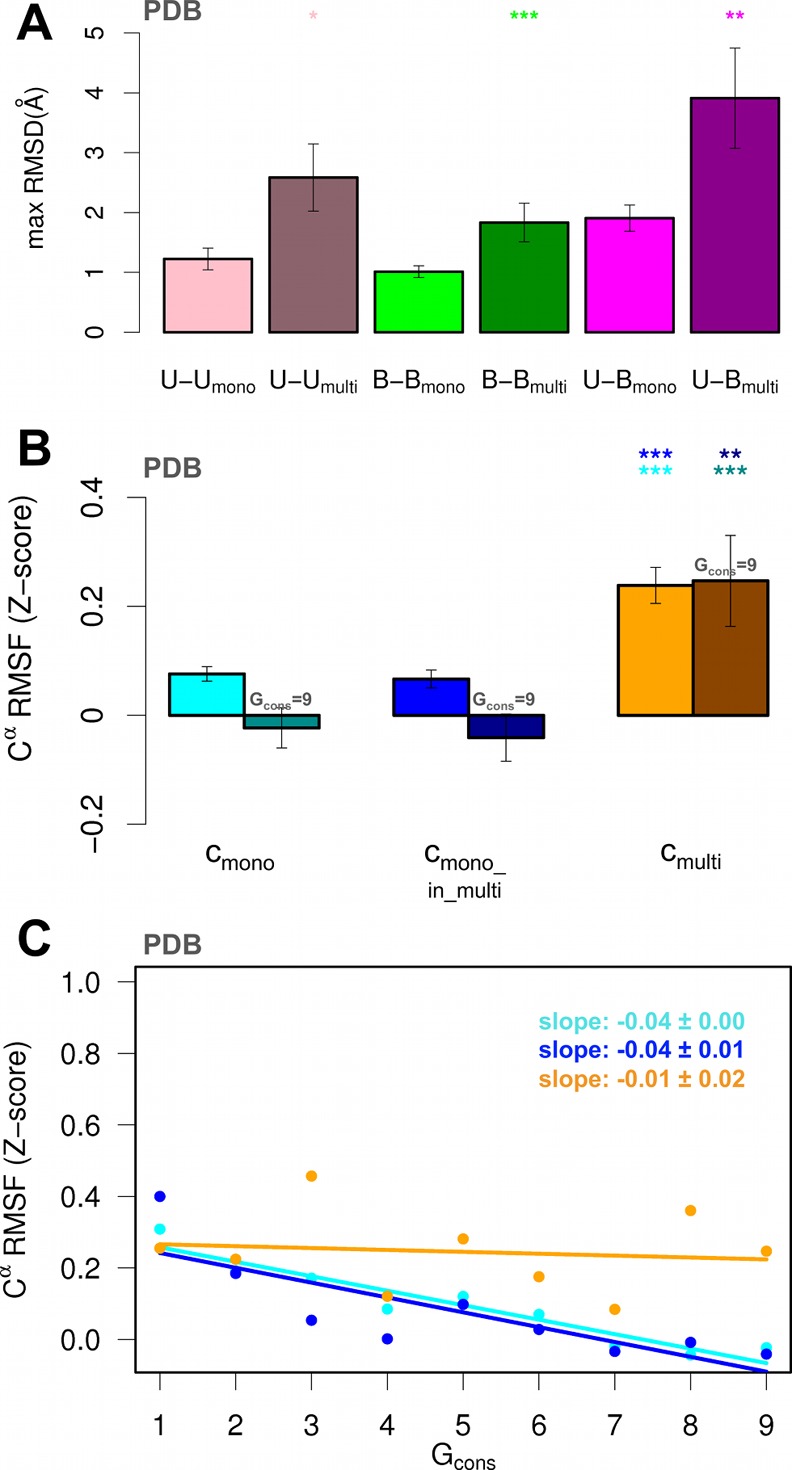
Analysis of the conformational variability within PDB ensembles in SFull. (A) Averages of maximum Cα RMSD values calculated over all the possible pairs of PDB structures within the unbound (pink) and bound (green) ensembles, and between bound and unbound structures (magenta) of each mono- (light color) and multi- (dark color) partner protein. The standard error of the mean is represented with an error bar. The significance levels from pairwise Wilcoxon comparison tests between (mono, multi) pairs of distributions are reported with a star code (see Figure 2 legend). (B) Average Cα RMSF Z-scores (PDB ensembles) calculated over cmono (cyan), cmono_in_multi (blue), and cmulti (orange) residues in the SFull data set. The standard error of the mean is represented with an error bar. The significance levels from pairwise Wilcoxon comparison tests are reported with a star code (see Figure 2 legend). Averages and significance levels calculated considering only the residues with the highest ConSurf conservation grade (Gcons = 9) are also reported in dark colors. (C) Dependence of PDB average Cα RMSF Z-scores (dots) from evolutionary conservation for cmono (cyan), cmono_in_multi (blue), cmulti (orange) residues. Residues are partitioned into 9 groups according to their ConSurf conservation grade (Gcons). A best-fit linear regression is also reported for each binding class.