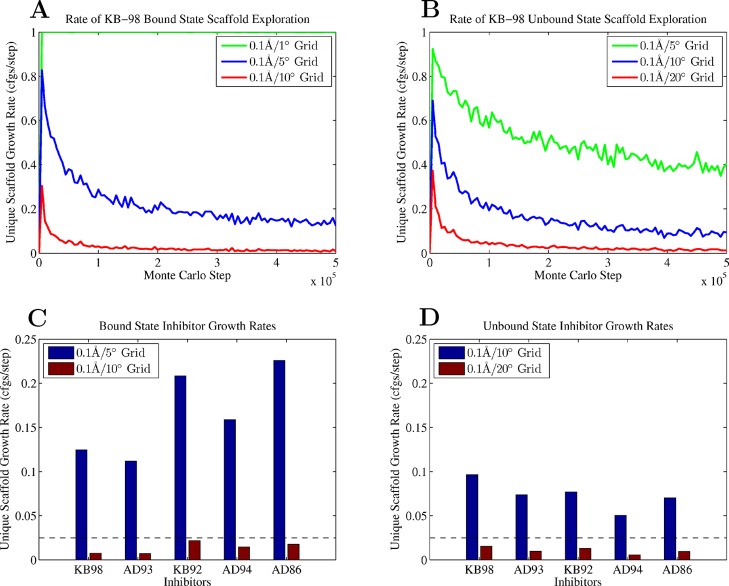
Figure 3.
KB-98 enumerative Monte Carlo scaffold grid resolution convergence. (A, B) The unique scaffold configuration and pose growth rates measured as a function of grid resolution and Monte Carlo simulation length in the bound and unbound states. (C, D) Final unique configuration growth rates for bound and unbound state. The dotted line indicates the 0.03 configurations per step acceptance cutoff used.

