
Figure 4.
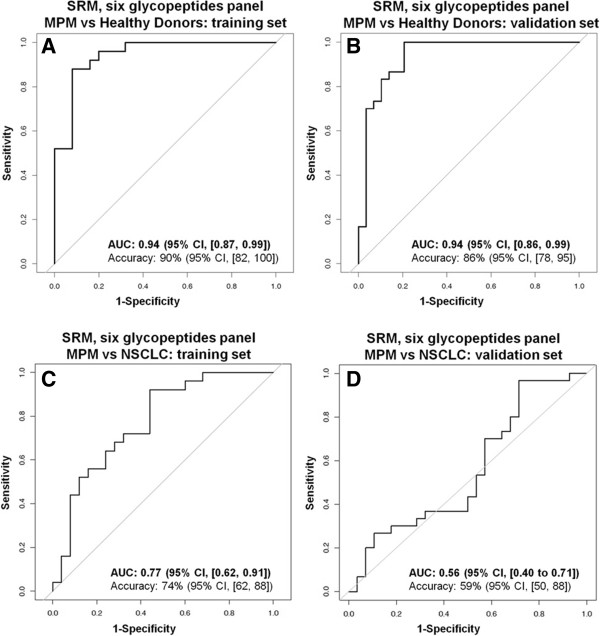
ROC curves of the six glycopeptides panel. Discrimination between MPM and HD (A, B) and MPM and NSCLC (C, D) in training (A, C) and validation (B, D) sets. Accuracies for MPM vs HD are at cut-off 0.61 and for MPM vs NSCLC at 0.35.
Official websites use .gov
A
.gov website belongs to an official
government organization in the United States.
Secure .gov websites use HTTPS
A lock (
) or https:// means you've safely
connected to the .gov website. Share sensitive
information only on official, secure websites.
ROC curves of the six glycopeptides panel. Discrimination between MPM and HD (A, B) and MPM and NSCLC (C, D) in training (A, C) and validation (B, D) sets. Accuracies for MPM vs HD are at cut-off 0.61 and for MPM vs NSCLC at 0.35.