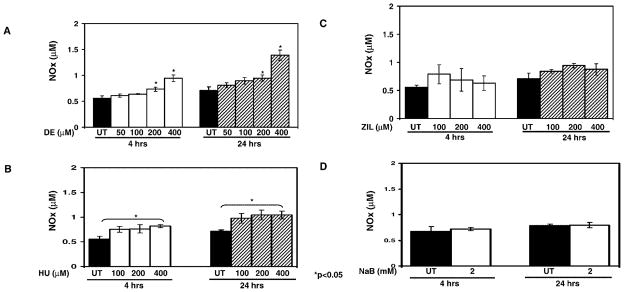
Figure 2.

NOx levels are increased by HU treatment. (A) Shown are the NOx levels for untreated (UT) K562 cells and cells treated with increasing concentrations of DE. Raw data are shown as the mean ± SEM. The asterisks (*) above the bar graphs indicate that the difference between the UT and drug-treated cells was significant at the values indicated. (B) K562 cells were treated with increasing HU concentrations and analyzed as described in panel A. (C) K562 cells were treated with ZIL and analyzed as described in panel A. (D) K562 cells were treated with 2 mM sodium butyrate (NaB) for 4 and 24 hr, and NOx levels were quantified.
