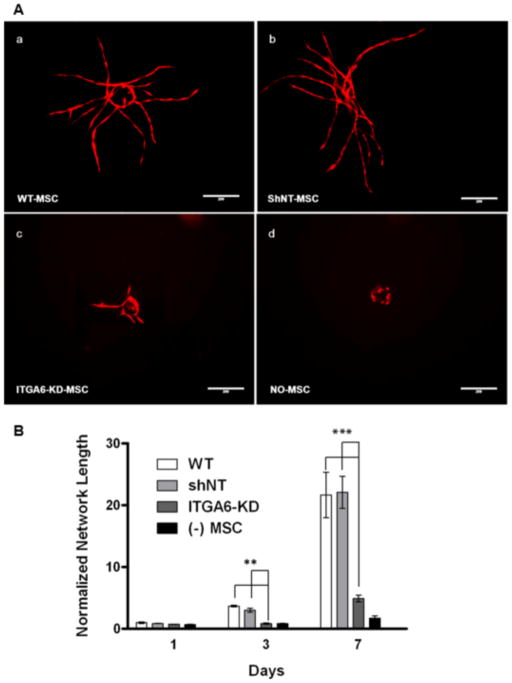
Fig 3. Knockdown of α6 integrin subunit expression in BMSCs diminishes vessel sprouting.
A: Day 7 fluorescent images of mCherry-expressing HUVECs co-cultured with (a) wild type BMSCs, (b) BMSCs transduced with non-targeting (NT) shRNA, (c) BMSCs with shRNA against ITGA6 or (d) no BMSCs. Scale bar = 200 μm. B: Total vessel network lengths were quantified from a minimum of 7 fluorescent images over three independent experiments and normalized by day 1 wild type BMSC condition. *** refers to p ≤ 0.001 with respect to the non-targeting (shNT) and wild type controls in the same group. A 2-way ANOVA followed by post-test analysis using Bonferroni’s method was used to compare conditions.

