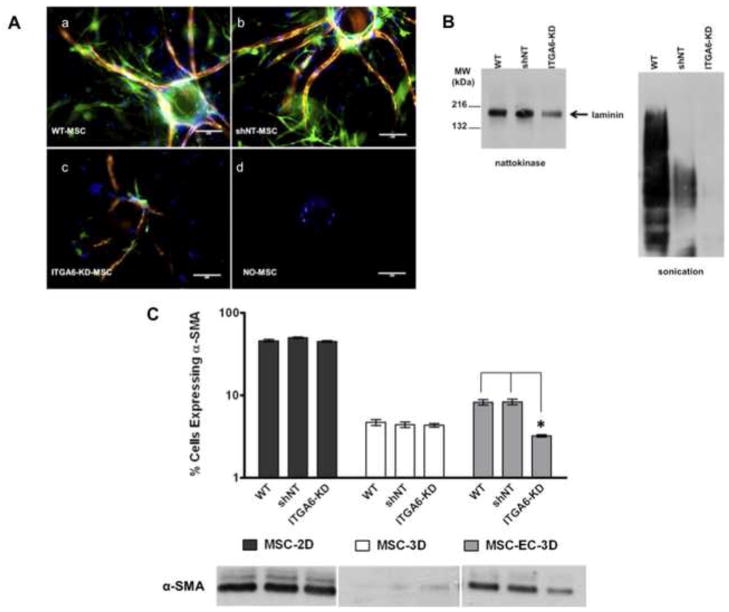
Fig 4. BMSCs with attenuated α6 integrin expression exhibit reduced association with vessel networks, disrupt laminin expression, and express reduced levels of αSMA.
A: Representative immunofluorescent images from day 7 3D co-cultures with HUVECs cultured on microcarrier beads in the presence of (a) wild type BMSCs (WT), (b) BMSCs transduced with non-targeting (NT) shRNA (shNT), (c) BMSCs with silenced α6 integrin (ITGA6-KD), or (d) no BMSCs. Cultures were stained for laminin (red), alpha smooth muscle actin (αSMA, green), and nuclei (DAPI, blue). Scale bar = 200 μm. B: Western blot analysis of laminin from lysates generated from 3D fibrin-based models of angiogenic sprouting after 7 days of culture. Lysates were generated either via nattokinase digestion of the fibrin matrix (left), or via sonication to break apart the fibrin (right). Blots were probed with a pan-laminin antibody that reacts with all laminin isoforms. C: Flow cytometric analysis of αSMA expression in WT, shNT, and ITGA6-knockdown BMSCs. Graph shows the percentage (%) of BMSCs expressing αSMA retrieved from day 7 HUVEC-BMSC co-cultures in three independent experiments. Western blot analysis of αSMA expression in BMSCs as a function of culture condition (3D with HUVECs, in 3D without HUVECs, and in 2D without HUVECs) qualitatively confirmed the quantitative flow cytometry results.

