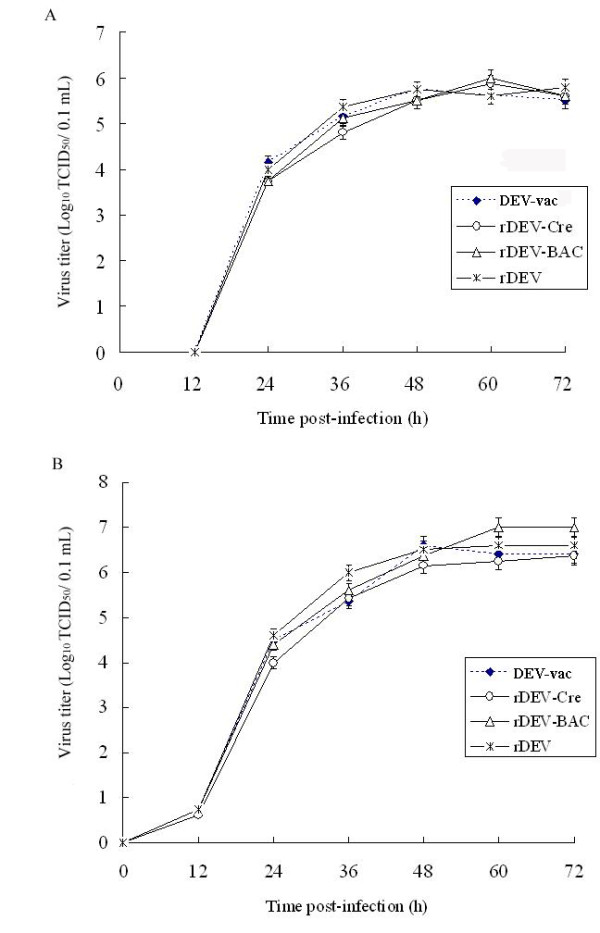
Figure 3.

Multi-step growth curves of rDEV, rDEV-BAC, rDEV-Cre, and DEV-vac. Comparison of the in vitro growth of viruses reconstructed with parental DEV. The virus titers of infected-cells (A) and supernatants (B) were determined at different times (0, 12, 24, 36, 48, 60, and 72 h) after inoculation of approximately 0.02 MOI of cell-free viruses of rDEV, rDEV-BAC, rDEV-Cre, and DEV-vac. The multi-step growth curves were computed from three independent experiments.
