Figure 1.
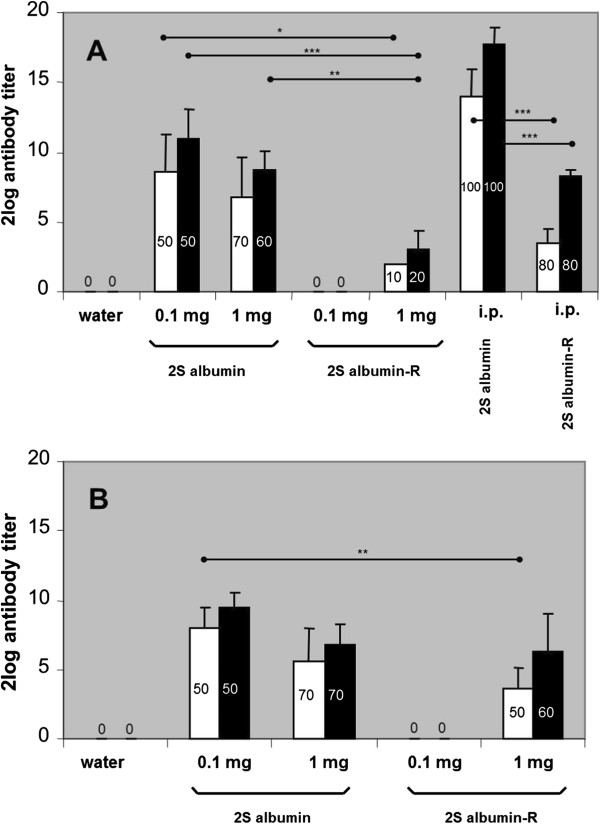
2S albumin and 2S albumin-R-specific IgG1 (■) and IgG2a (□) titers were analyzed upon daily intra-gastric dosing of BN rats (n=10/group) with water, 0.1 mg and 1 mg 2S albumin or 2S albumin-R per rat for 28 days (A) or 42 days (B). Positive control animals (n=5/group) received multiple i.p. sensitizations prior serum analyses at day 28 (A). The data are presented as mean 2log Ig titer ± SD of the number of responding rats (indicated as percentage in the bars) per group. Statistical differences between oral dosing groups or between i.p. dosing groups are depicted (*p < 0.05, **p < 0.01, ***p < 0.001).

