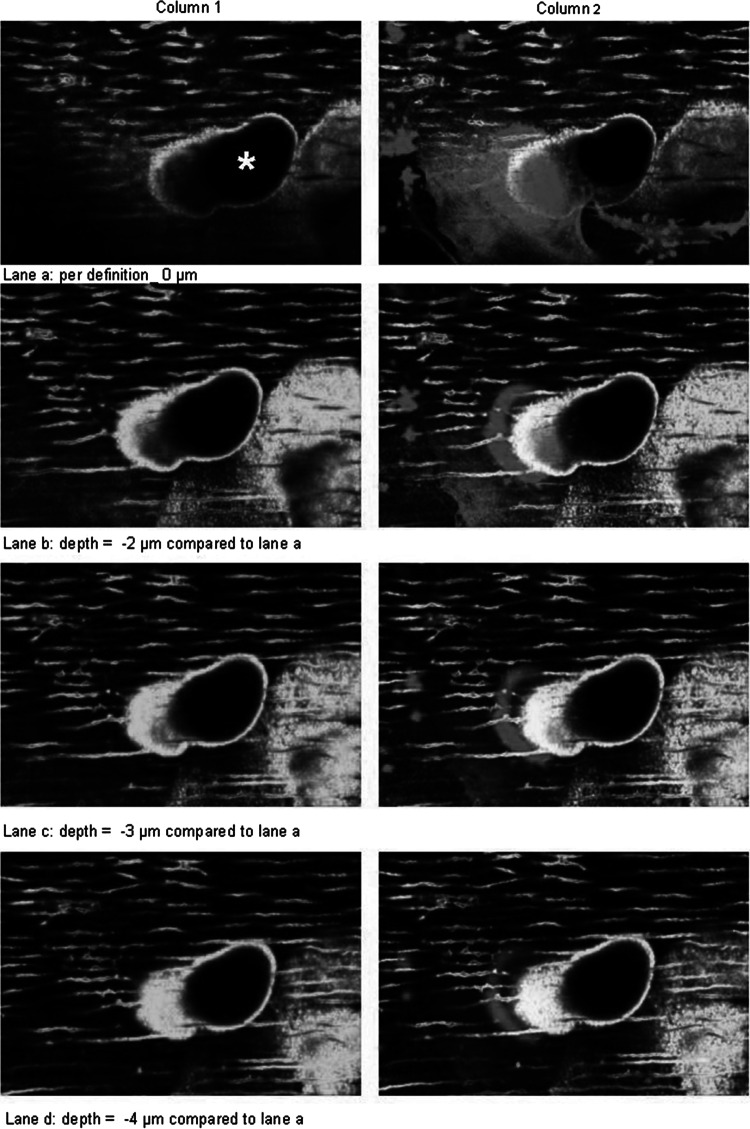
Fig. 6.
3D imaging of a resorbing osteoclast with confocal laser scanning microscopy. Column 1 = calcein staining of dentin (green); column 2 = overlay pictures of actin staining (red) and calcein staining (yellow signal = overlay of red and green); lane a = depth per definition = 0 μm; depth of lane b = 2 μm; depth of lane c = 3 μm, depth of lane d = 4 μm relative to lane a. *Resorption trail

