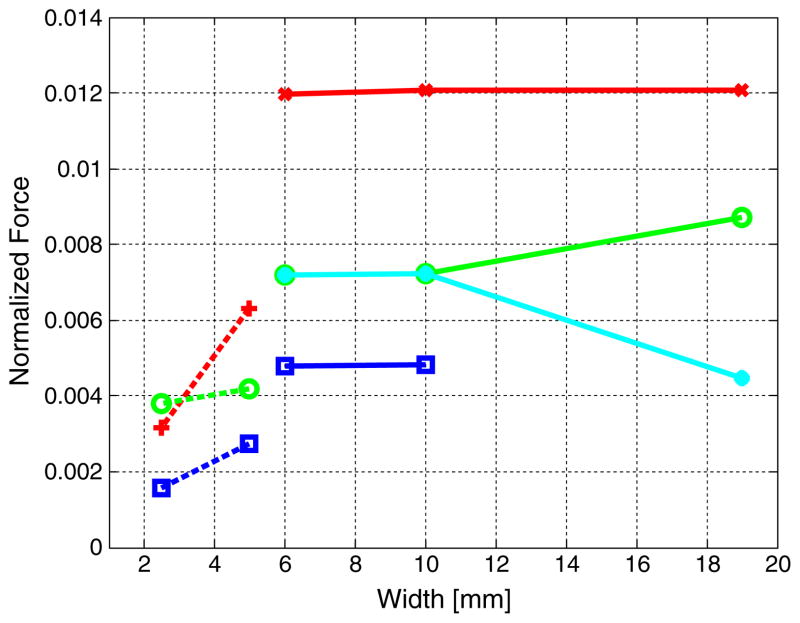
Fig. 10.
Comparison of the normalized propulsive force at different widths. Tails II, III and IV are compared at the input currents and frequencies: 2.39 mApp and 1 Hz (red line with cross marker); 4.96 mApp and 5 Hz (green line and hollow circle marker); 4.96 mApp and 20 Hz (blue line and square marker) and 7.19 mApp and 20 Hz (cyan line and full circle marker). Tails I and V are compared at the input current 25.31 mApp and the frequencies: 10 Hz (red dashed line with plus marker); 20 Hz (green dashed line with circle marker) and 45 Hz (blue dashed line with square marker)

