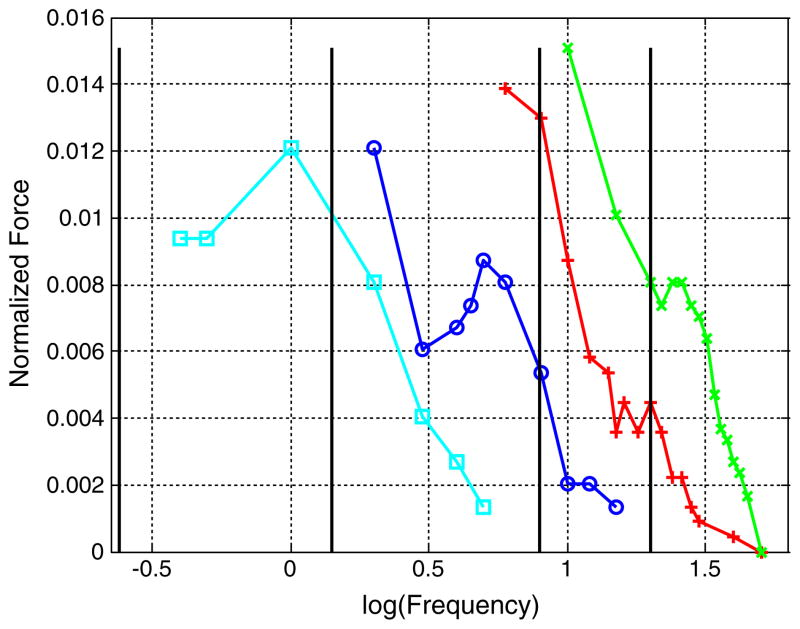
Fig. 15.
Swimming results for a tail IV. Each cross mark represents a data point from the experiment. The coil driving currents were: 2.39 mApp (cyan square), 4.79 mApp (blue circle), 7.19 mApp (red plus) and 9.59 mApp (green cross). The vertical solid black lines denote the natural frequencies calculated from the model

