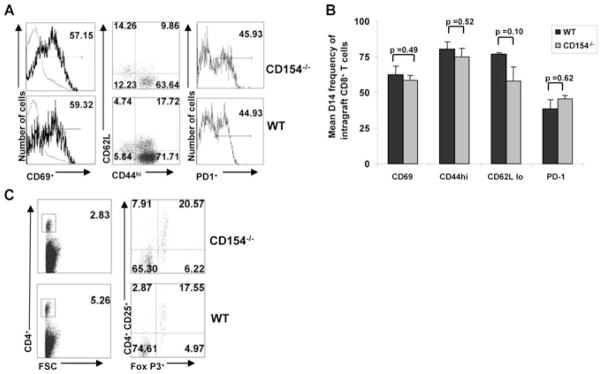
Figure 5. Despite impaired effector function, CD8+ T cells from CD154−/− recipients display an activated, effector memory phenotype.

(A) Representative flow cytometry for CD69, CD44, CD62L and PD-1 surface expression in day 14 CD154−/− and WT control recipients in intragraft CD8+ T cells. Quadrant values represent detected frequencies of each population, gating on CD8+ T cells. In histograms, percent of intragraft positive CD8+ T cells are numerically displayed in upper right corner. (B) Mean CD69, CD44hi, CD62Llow and PD-1 expression in day 14 CD154−/− and WT control recipients. Bars represent mean frequencies ± SEM from each treatment group with p-values determined by rank sum test. Results are combined from minimum four separate experiments with pooled responses from 3 to 5 mice per group. (C) Representative flow cytometry for CD4, CD25, and intracellular Foxp3 expression, in day 14 CD154−/− and WT control recipients. Quadrant values represent detected frequencies of each population, gating on CD4+ T cells.
