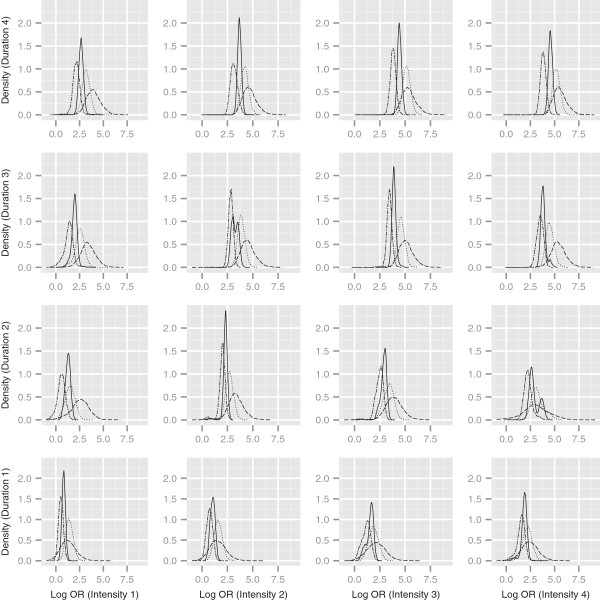
Figure 4.
Log odds ratios for different histologies. Density estimates of predicted log odds ratios relative to a non-smoking profile, for different intensity and duration combinations. Line types denote different histologies: solid = all histologies, double dashed = adenocarcinoma, dotted = squamous and dashed = small cell. Time since cessation and pack-years treated as missing in pseudo-profiles.

