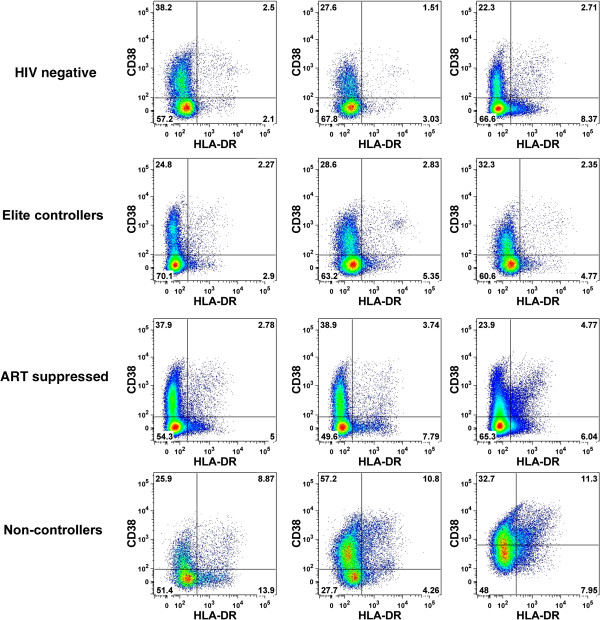
Figure 3.
Frequency of activated CD4+ T cells across HIV-1 disease states. CD38 and HLA-DR expression on the surface of CD4+ T cells was measured by flow cytometry. Plots for three representative, median individuals are included for each HIV-1 disease state. Percentages of activated cells (co-expressing CD38 and HLA-DR) are reported in the upper-right quadrant of each plot.

