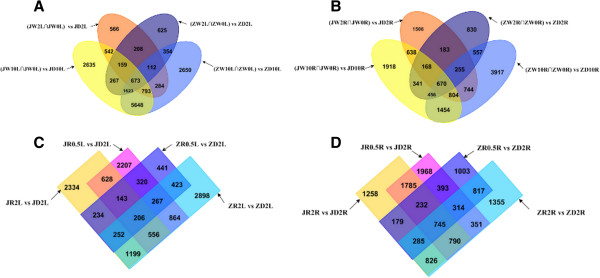
Figure 5.

Venn diagram of DEGs in two genotypes. (A) Venn diagram of DEGs in leaves under dehydration. (B) Venn diagram of DEGs in roots under dehydration. (C) Venn diagram of DEGs in leaves under rehydration. (D) Venn diagram of DEGs in roots under rehydration.
