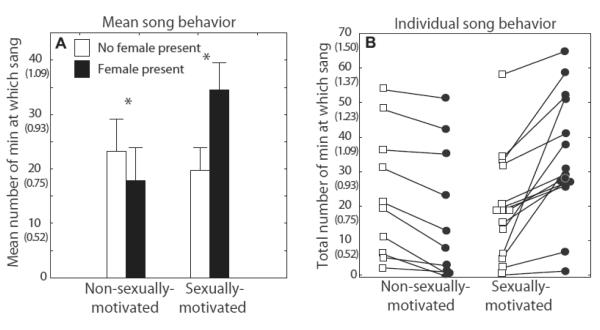
Figure 3.
A) Untransformed mean number of minutes + sem and B) the total number of minutes for each individual at which males in the non-sexually-motivated and sexually-motivated groups were singing when no female was present and when a female was present. The lines in panel B connect data points from single individuals. Untransformed data are presented in these figures to illustrate actual song data with the arcsine transformed values in parentheses below to aid in interpretation of transformed values in Figs 4 - 6. Analyses were performed on arcsine transformed data as detailed in the methods. * = significant posthoc results, p < 0.05.

