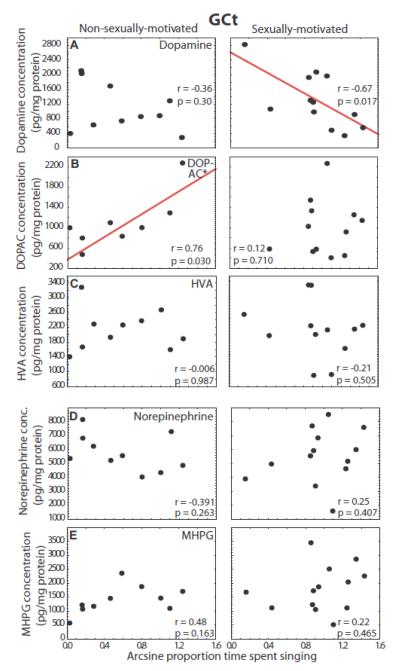
Figure 5.
Correlations between catecholamine markers in GCt and song. Scatterplots showing correlations between concentrations of dopamine markers (A - C) and norepinephrine markers (D and E) and individual variation in singing behavior in non-sexually-motivated (left column) and sexually-motivated males (right column). Each point represents one individual and the presence of a solid regression line indicates a significant linear correlation (p<0.05). * next to marker labels indicates that the slopes of the two correlations for a given marker differ significantly, p < 0.05.

