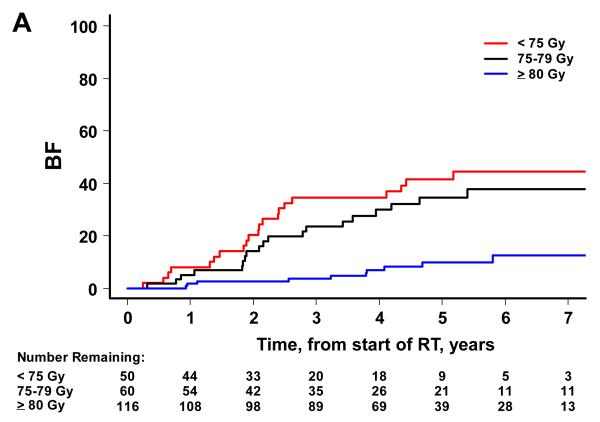
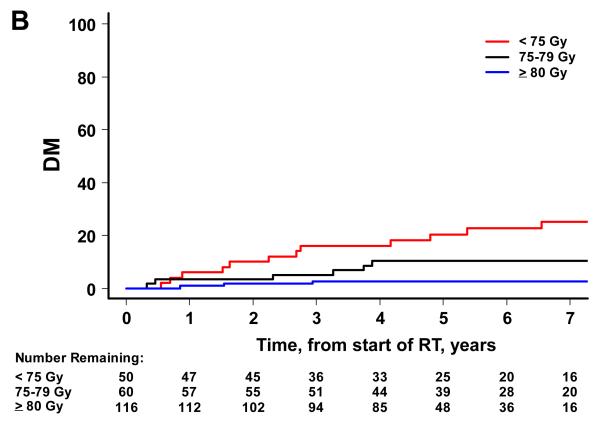
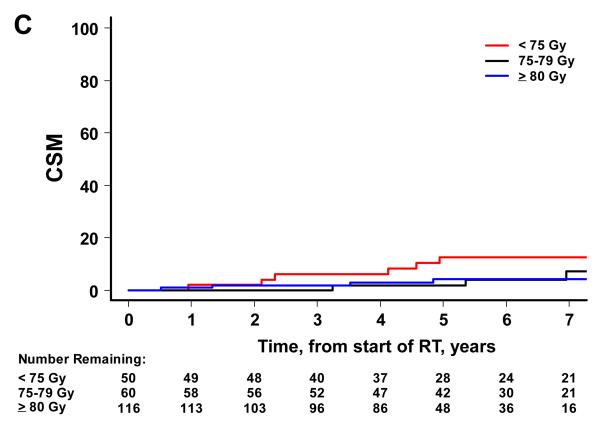
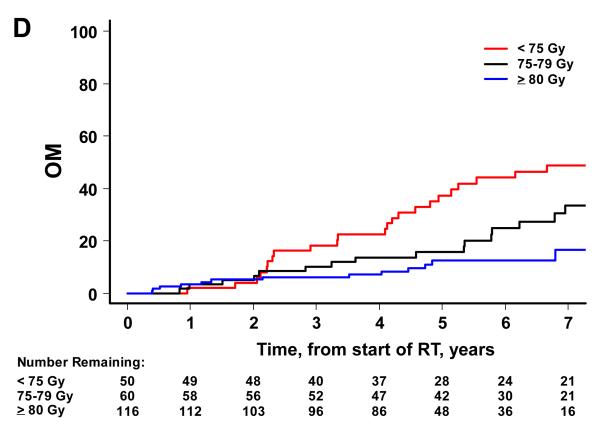
Figure 2.
Patient outcome by dose group. The cumulative incidence curves by dose group are shown for BF (A), DM (B), and CSM (C) using the competing risks method, and for OM (D) using the Kaplan Meier approach. A significant association is noted with higher RT dose and better outcome for BF (p<0.001), DM (p<0.001), and OM (p<0.001). For CSM, results were not significant (p=0.387).


