Figure 3.
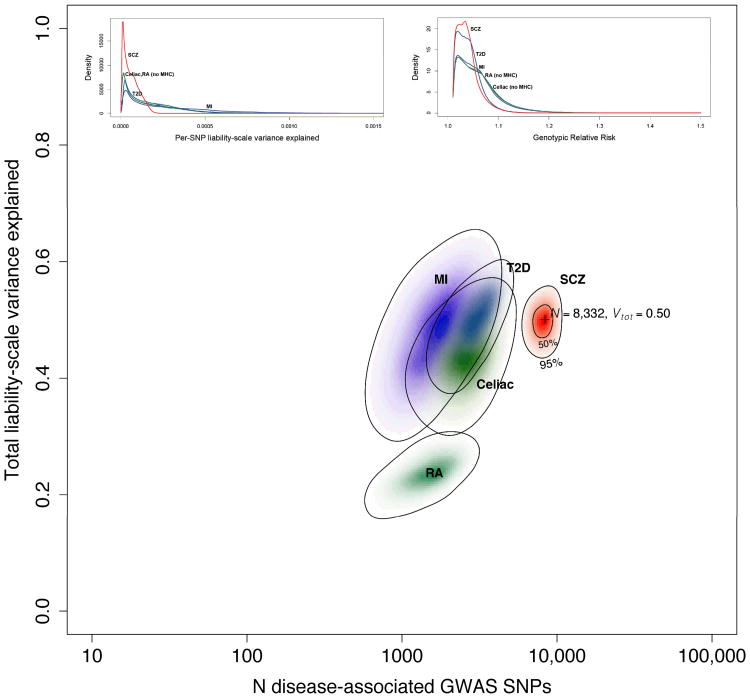
The main figure shows the results of ABPA modeling based on the Sweden + PGC results (population risk 0.01). The x-axis is the estimated number of SNPs on a log10 scale, and the y-axis estimates the total variance in liability explained. The results for five conditions are shown: schizophrenia (this analysis, red) and, for comparison, results from a published analysis of myocardial infarction (MI, purple), type 2 diabetes mellitus (T2D, blue), celiac disease (green), and rheumatoid arthritis (RA, teal). 71 The schizophrenia results are based on 1000 Genomes imputation, and the others on HapMap3 imputation. Color intensity reflects the probability density with darker colors indicating higher density. Contour lines show 50% and 95% credible regions for SCZ, and 95% credible regions for the other diseases. The insets depict estimated SNP distributions for the five disorders: (a) distribution of SNPs in terms of the variance in liability explained per SNP and (b) the estimated distribution of SNP genotypic relative risks (GRR). We again stress that multiple qualifiers are essential in interpreting these estimates.

