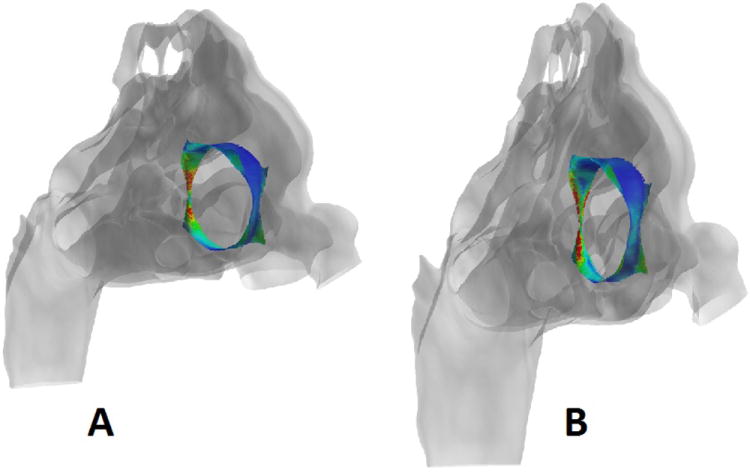
Figure 4.

Representative images from the 2 cm posterior perforation model showing heat flux (A) and wall shear (B). In each case, the perforation site is color coded with blue representing low values and red high values for the parameter of interest. The perforation has been isolated and the remainder of the nasal cavity rendered transparent to allow visualization and the models are being viewed from an anterior oblique angle, with the nostrils on the right and the nasopharynx on the left.
