Figure 4.
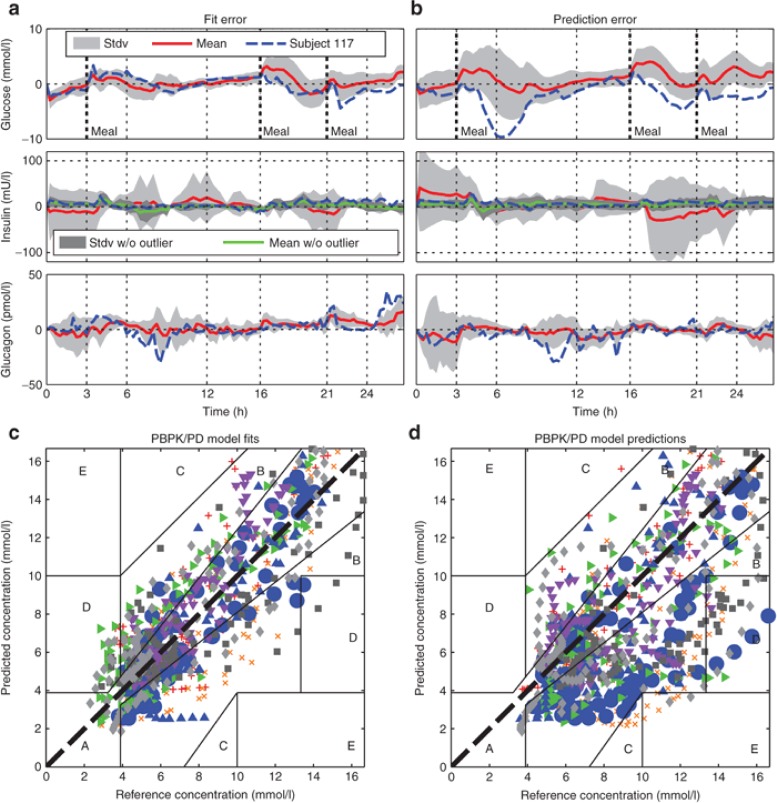
Mean error residuals of simulated fitted (a,c) and predicted (b,d) trajectories of peripheral venous blood plasma concentrations of glucose (top), insulin (center), and glucagon (bottom) from all eight subjects from the first (a) and second (b) visit, respectively, displayed in comparison to the exemplary residual error from Subject 117. Visualized as time-concentration-error curves (a,b, for glucose (top), insulin (center), and glucagon (bottom) concentrations) and in a Clarkes Error Grid Analysis styled visual predictive check (c,d, only glucose concentrations). Displayed are for the eight subjects the mean error residuals (red solid lines, a,b), standard deviation of mean error residuals (light grey shaded area, a,b), all individual residual errors of glucose (c,d) as well as the single residual error from Subject 117 (blue dashed line, a,b, and large blue dots, c,d). For insulin concentration curves (a,b, center), the dark shaded area represents the mean error residuals without the outlier Subject 122.

