

The aim of this tutorial is to introduce the concept of physiologically based pharmacokinetic (PBPK) modeling to individuals in the pharmaceutical industry who may be relatively new to this area and to demonstrate application of this approach in a preclinical and clinical setting. The tutorial provides some background on PBPK models and their data requirements, introduces strategies for PBPK modeling in drug development, and includes a discussion on regulatory considerations and potential resource issues.
Different PK Model Types: Classical Vs. PBPK Models
Mathematical models are frequently used to help understand the PK of drugs following intravenous (i.v.) and oral dosing in animals and humans. Models describing other routes of administration, e.g., transdermal delivery of drugs across skin, are also available.1 These models are often used to describe the relationship between the plasma or relevant tissue concentration of the drug and time and are built using compartments or “building blocks”. A classical PK model typically has a central compartment representing plasma that is linked to one or two peripheral compartments via rate constants.2 When defined in the terms of rate constants, the model parameters do not generally have any physiological meaning but can be transformed to provide more interpretable PK descriptors, e.g., clearance and volume of distribution. Clearance refers to the volume of plasma cleared of drug per unit time via metabolic or excretion processes. The volume of distribution refers to the volume of plasma required to occupy the total amount of drug in the body at the concentration observed in plasma. Both the clearance and volume of distribution can be used to calculate the effective half-life or “residence” time of the drug. In this context, these models are useful as they offer a concise and standard representation of both the preclinical and clinical experimental results.
In a preclinical setting, PK parameters from different in vivo studies can be used to rank compounds for further investigation or can be linked to physicochemical, in vitro or structural properties to guide optimization of PK properties for new compounds. In the clinical setting, PK parameters for different subjects can be compared and potentially related to demographic characteristics, or PK parameters derived from one study design can be used to simulate plasma concentrations for alternative doses or dosing regimens. Typically, population PK models, which aim to describe the covariates of variability in drug concentrations and PK parameters among individuals in the target patient population, are used to inform initial dose selection or personalize dosage in subgroups of patients. Demographic and physiological variables, including body weight and metabolic functions, are often evaluated as covariates as it is known that these can affect dose–concentration relationships. However, these more empirical approaches cannot accommodate all prior information on both the drug and the physiology, thus restricting the ability to predict PK for a similar drug or to extrapolate the PK to different physiological conditions.
Although PBPK models are built using a similar mathematical framework, they are parameterized using known physiology and consist of a larger number of compartments which correspond to the different organs or tissues in the body. These compartments are connected by flow rates that parallel the circulating blood system. These models, like the more empirical models, provide estimates of common PK parameters, e.g., clearance, volume of distribution, and effective half-life. However, these more physiologically relevant models provide a quantitative mechanistic framework by which scaled drug-specific parameters (using in vitro-in vivo extrapolation (IVIVE) techniques) can be used to predict the plasma and, importantly, tissue concentration–time profiles of new drugs, following i.v. or oral administration. By their very nature, they can be used to extrapolate a dose in healthy volunteers to one in a disease population if the relevant physiological properties of the target population are available. For example, data relating to reduced cytochrome P450 (CYP) expression in patients with chronic kidney disease can be incorporated into a PBPK model (along with other parameters that are known to be affected) to predict a dose adjustment of a drug relative to that in a healthy volunteer population.3
Brief History of PBPK Models
Modeling and simulation approaches have become an integral part of drug discovery and development. Appropriate models can provide a framework for predicting the exposure, response, and time course of a drug for different dosage regimens in a target population. PBPK models can be used to predict the PK of a drug and when used in combination with PK-pharmacodynamic (PD) models, can predict the effect profile and dose of new drug entities to attain the desired exposure in vivo. This is particularly relevant for PBPK models as predicted concentrations at the site of action can be used as input into PK-PD models, although such applications may need to be validated with preclinical tissue data to provide more confidence. PBPK models are constructed using a series of differential equations that are parameterized with known physiological variables and represent a quantitative mechanistic framework by which the absorption, distribution, metabolism, and excretion (ADME) of new drugs can be described. Integral to this approach is IVIVE, which has accelerated mainly due to the increasing availability of in vitro systems which act as surrogates for in vivo reactions relevant to ADME. Application of PBPK modeling used in conjunction with IVIVE of ADME data can provide a useful starting point to understand and extrapolate PK and dose across different species, populations, and disease states.4
The concept of PBPK modeling is not new. Indeed, the use of multicompartmental models, incorporating biological and physiological components for the simulation of PK data was introduced by Teorell as early as 1937.5 Another early report of PBPK modeling that has been integral to the development and application of the methodology was described by Bischoff.6 However, until recently, the application of PBPK models in the pharmaceutical industry has been limited due to the mathematical complexity of the models and the perceived demand for a large number of parameters required as inputs to the models. For example, in the past, large amounts of in vivo animal tissue concentration data were required to assess the distribution of a drug in tissues.7,8 However, the availability of methods to predict one of the key drug-specific parameters in a PBPK model, the tissue to plasma partition coefficients (Kp values), from in vitro and in silico data9,10,11 have certainly made the routine application of PBPK modeling more appealing.
Over the past decade, the number of publications involving PBPK modeling has increased significantly, demonstrating the widespread use of this approach across the scientific community.12,13,14 As a result of this and the increasing availability of commercial platforms which integrate these methodologies, such as the Simcyp Population-Based Simulator (Simcyp, Sheffield, UK) (http://www.simcyp.com/), GastroPlus (Simulations Plus, Lancaster, CA) (http://www.simulations-plus.com/), and PKSIM (Bayer Technology Services, Leverkusen, Germany) (http://www.systems-biology.com/products/pk-sim.html), there has been growing interest in the application of PBPK modeling by the pharmaceutical industry. In this context, this methodology is now being used throughout the drug discovery and development process. Drug discovery is becoming increasingly “data rich” with high-throughput screening of numerous compounds for pharmacological and PK properties. Most of the preclinical ADME data can be used for PBPK modeling. Of particular importance is the fact that pharmaceutical companies are now including the PBPK modeling approach in dossiers submitted to regulatory agencies.15 Between June 2008 and December 2012, there were 33 such cases included in submissions to the Food and Drug Administration.15 Guidance documents on assessment of the drug–drug interaction (DDI) potential of drugs in development were updated and issued recently by both the Food and Drug Administration16 and the European Medicines Agency;17 the use of PBPK modeling was advocated by both the agencies. Furthermore, a discussion on best practice in the use of PBPK modeling to address regulatory questions in the area of Clinical Pharmacology was also published by Zhao et al.18 Therefore, it appears that PBPK modeling is definitely “here to stay”!4
Components of a PBPK Model
PBPK model structure and assumptions
As mentioned previously, PBPK models consist of compartments corresponding to different tissues in the body, connected by the circulating blood system. A schematic representation of a typical PBPK model is shown in Figure 1. Each compartment is defined by a tissue volume (or weight) and tissue blood flow rate which is specific to the species of interest. These “system” specific parameters, which differ across species, are described in more detail in the “System-Related Input Parameters” section. Typically, these compartments include the main tissues of the body, namely, adipose, bone, brain, gut, heart, kidney, liver, lung, muscle, skin, and spleen.7,12 However, in some cases, reduced models have been described that “lump” tissues with similar blood flow rate properties together to reduce the number of compartments and overall complexity of the model.19,20 Each tissue is typically described as either perfusion rate limited or permeability rate limited.7,21,22,23 A schematic representation of these different types of tissue models is shown in Figure 2.
Figure 1.

Schematic of a PBPK model. Insert denotes detailed representation of the intestine. CLint, intrinsic clearance; PBPK, physiologically based pharmacokinetics.
Figure 2.

Perfusion vs. permeability rate-limited tissue models. (a) Perfusion rate limited; (b) Permeability rate limited. Kp, tissue to plasma partition coefficient; RBC, red blood cell.
Perfusion rate-limited kinetics tends to occur for small lipophilic molecules where the blood flow to the tissue becomes the limiting process. This type of model assumes that at steady state, the total drug concentration in the tissue is in equilibrium with the total drug concentration in the circulation as determined by the drug-specific Kp value (see “Drug-Specific Input Parameters” Section), whereas free drug concentrations (i.e., those not bound to proteins) are equal. The time taken to reach steady state is determined by the blood flow rate, tissue volume, and Kp value for the particular tissue. Typically, a highly perfused tissue will reach steady state faster than a poorly perfused tissue. Permeability rate-limited kinetics occurs for larger polar molecules where the permeability across the cell membrane becomes the limiting process. In this case, the tissue is divided into essentially two compartments, representing the intracellular space and the extracellular space, which are separated by a cell membrane that acts as a diffusional barrier (Figure 2). Typically, at steady state, this model will also reach equilibrium where free drug concentrations (i.e., those not bound to proteins) are generally equal. However, for this particular model, the time to reach equilibrium is highly dependent on the drug-specific permeability rather than the blood flow, which is used to estimate a permeability rate constant that drives the equilibrium across the cell membrane between the intracellular and the extracellular concentrations. If active transport processes are involved either into or out of the intracellular space, free concentrations in the intracellular space may be higher or lower than the extracellular space, respectively. Such active transport processes are modeled by incorporating uptake parameters into a permeability rate-limited model and are discussed in more detail in the “Drug-Specific Input Parameters” section.
Generic PBPK models used in drug discovery usually assume perfusion rate-limited kinetics with the liver and kidney being the only sites of clearance.22,23,24,25,26 The mass balance differential equations used in these models have been described many times, some recent descriptions can be found in publications by Jones et al.22,23 For non-eliminating tissues, they follow the principles shown below, where the “rate of change of drug in the tissue” is equal to the “rate in” (QT .CA) minus the “rate out” (QT .CvT).
 |
where Q = blood flow (l/h), C = concentration (mg/l), V = volume (l), T = tissues, A = arterial, v = venous, CvT = CT/(Kp/B:P), B:P = blood to plasma ratio.
For eliminating tissues, the free concentration in the venous blood leaving the tissue (which is assumed to be equal to the free concentration of drug at the enzyme/elimination site) is used to drive the clearance rate. The equation in this case follows the principles shown below, where the “rate out” also includes the rate of elimination (QT .CvT + CLint.CvuT).
where CLint = the intrinsic clearance of the compound (l/h) and u = unbound. The CLint refers to the intrinsic ability (unbound) of a compound to be metabolized by relevant enzymes in the absence of extrinsic factors such as protein binding and blood flow. The calculation of this parameter will be described in more detail in the “Drug-Specific Input Parameters” section. Some examples of PBPK model code can be found in the Supplementary Data online. In this example, each tissue is described by perfusion rate-limited kinetics and the clearance process is incorporated for the liver and kidney.
The models described so far can be used to simulate plasma and tissue plasma concentration–time profiles following i.v. administration. For oral administration, which is more complex, a number of absorption models have been described in the literature.27,28,29,30 Essentially, the gut (Figure 1) is separated into two main compartments representing the lumen (unabsorbed drug) and enterocyte (absorbed drug). Each compartment is further split into a number of subcompartments corresponding to the different regions of the gastrointestinal tract, namely, the stomach, duodenum, jejunum, ileum, cecum, and colon. Each of these subcompartments is defined by a subtissue volume, transit time, and pH. The subtissue volume and transit times are used in an analogous fashion to the perfused tissue equations to describe the movement of the drug through the gastrointestinal tract. Drug-specific parameters, e.g., ionization coefficient (pKa), octanol to water partition coefficient (logP), and solubility, are used in this model to describe the dissolution and precipitation of drug via pH-partition theory as it transits through the lumen of the gastrointestinal tract. The drug-specific permeability data is used to model the absorption of dissolved drug in the lumen to absorbed drug in the enterocyte. Estimation of some of these parameters is described in more detail in the “Drug-specific Input Parameters” section. Typically, these models assume passive absorption with no significant contribution from active transport processes. However, again in an analogous fashion to the perfused tissue equation, active uptake or efflux transport processes can be incorporated if relevant drug-specific parameters are available to drive model estimates of lumen or enterocyte concentrations, respectively. PBPK models integrating both disposition (i.v.) and oral absorption processes have been described in the literature13,14 and are integrated within commercial platforms, including Simcyp (http://www.simcyp.com), GastroPlus (http://www.simulations-plus.com), and PKSIM (http://www.systems-biology.com/products/pk-sim.html). Alternatively, PBPK models can be coded up with commonly used modeling software, e.g., NONMEM, ADAPT, Berkeley Madonna, SAAM, and WinNonlin etc., an example of which can be found in the Supplementary Data online.
System-related input parameters
PBPK models have been developed for many species, the most common being mouse, rat, dog, and human. System-dependent parameters to support such models are routinely available in the literature31 and have been utilized for the purpose of PBPK modeling by a number of investigators.22,23 Indeed, PBPK models for the most common species are provided in all commercially available PBPK software.
Given the mechanistic nature of these models, it is also possible to incorporate physiological and mechanistic features to predict PK and dose in specific disease states and population groups. In this context, several authors have incorporated known changes in hepatic blood flow, CYP, liver volume, hematocrit, and liver/renal function as a function of disease or age, to predict human PK in different populations.3,32,33 Databases to support such modeling can be found in the literature; these include the elderly impaired,34 pediatrics (including ontogeny),35 pregnancy,36 obesity,37 comorbid diseases such as cirrhosis32,33 and chronic kidney failure,4 and environmental factors such as smoking.38
A key advantage of PBPK models is the ability to include sources of physiological and biochemical variability in the system parameters and to simulate the expected PK in a population of individuals rather than for an average subject. A virtual population can be generated from values and formulae describing demographic, anatomical, and physiological variables using a correlated Monte Carlo approach.39 Equations describing distributions of system parameters for the PBPK model are derived from distributions of data based on real populations and patients. This allows prediction of variability before clinical studies in contrast to a statistical approach (population PK analysis), which requires prior clinical data to characterize variability. Being able to assess variability in a population is particularly important when considering the risk associated with DDI, as it is usually a few individuals with certain characteristics that are of more concern than the average individual.
Drug-specific input parameters
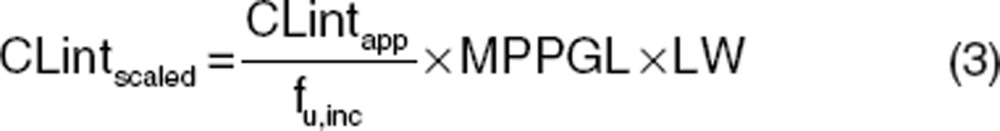
To simulate i.v. and oral plasma concentration–time profiles using generic PBPK models, additional drug-specific inputs are also required (e.g., CLint and Kp values). This section describes how these input parameters are estimated. An understanding of the key ADME mechanisms for a particular compound together with well-defined and measured drug-specific parameters is key to prediction success. In vivo intrinsic organ clearance is a key parameter for PBPK models for the characterization of in vivo clearance. For hepatic clearance, this can be scaled from a variety of in vitro systems (e.g., recombinant enzymes, microsomes, and hepatocytes) using physiological scaling factors such as intersystem extrapolation factors, microsomal recovery, hepatocellularity. For microsomes and hepatocytes, these scaling calculations are shown below in Eqs. 3 and 4, respectively.
 |
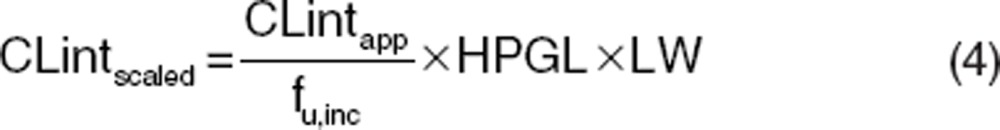 |
where CLintscaled is the scaled in vivo CLint in ml/min, CLintapp is the apparent in vitro CLint (μl/min/mg for microsomes and μl/min/million cells for hepatocytes), fu,inc is the fraction unbound in the in vitro system, MPPGL is the milligrams of microsomal protein per gram of liver (mg/g), LW is liver weight (kg), and HPGL is the hepatocellularity per gram of liver (106/g).
These values can then be used directly in PBPK models after conversion to relevant units40 or can be used together with extrinsic factors, e.g., blood-binding data and liver blood flow within well-defined liver models, e.g., well-stirred and parallel tube models to predict hepatic clearance.41 These approaches to predict hepatic clearance have been described in detail by a number of authors42,43 and have been extensively validated.41,44 For other clearance mechanisms such as renal/biliary excretion, a number of other approaches can be used to predict in vivo intrinsic organ clearance. Most frequently, allometry-based approaches are employed which take the form of Eq. 5 where unbound clearance is scaled from a single species or across multiple species.45,46
 |
where a is the allometric coefficient, b is the allometric power function, and BW is body weight. These predicted clearance values need to be converted to in vivo CLint values at the relevant tissue before input into the PBPK model. Alternatively, in vitro-in vivo scaling approaches are available for some mechanisms, e.g., biliary excretion, and have been employed in a small number of cases.47,48
Another important set of compound-specific parameters are the Kp values which are used to characterize the distribution or “movement” of the compound into different tissues in the body. Kp values are defined as the ratio of total concentration of compound in the tissue to total concentration of compound in the plasma at steady state. More mechanistically, these Kp values represent the degree of tissue accumulation attributed to processes such as protein binding, lysosomal trapping, and lipid dissolution. Typically, in the past, Kp values would be measured experimentally via costly and time-consuming preclinical tissue distribution studies where tissue and plasma drug concentrations would have been measured over time and at steady state.21 However, in recent times, a number of mechanistic methodologies have been described in the literature for the prediction of Kp values. The development of mechanistic tissue composition-based equations for the prediction of Kp values and hence distribution in rat, dog, and human have revolutionized and more fully enabled the routine application of PBPK methods in early drug discovery. Rather than requiring in vivo data, these models estimate the extent of tissue distribution from the physicochemical and in vitro binding characteristics to lipids and proteins of the compound. The equations developed by Poulin and coworkers9,10 assume that the drug distributes homogenously into the tissue and plasma by passive diffusion accounting for nonspecific binding to lipids estimated from drug lipophilicity data and specific reversible binding to proteins present in plasma and tissue estimated from plasma protein binding. Rodgers and coworkers11 extended these equations by incorporating ionization/charge considerations. These equations account for partitioning of unionized drug into neutral lipids and neutral phospholipids, dissolution of ionized and unionized drug in tissue water, electrostatic interactions between ionized drug and acidic phospholipids for strong ionized bases, and interactions with extracellular protein for neutrals, weak bases, and acids. The tissue composition-based equations described above have each been designed to describe specific interactions. Recently, unified algorithms combining these different individual mechanisms have been developed to facilitate their application.49,50 Furthermore, Vss can be calculated using Eq. 6.
 |
where VP = volume of plasma.
A number of studies have been performed to investigate predictability of these different mechanistic approaches for Kp prediction using a range of drug datasets, with varying degrees of accuracy.22,23,26,51,52 It should be noted that PBPK models constructed using in silico Kp parameters (i.e., without measured tissue data) may represent an oversimplification of tissue kinetics. If drug concentrations in specific target tissues are of particular interest, in vivo tissue distribution data may be required to further inform the model.
An important component of any oral PK simulation is the prediction of the rate and extent of absorption. The absorption models developed by Simcyp (“Advanced, Dissolution, Absorption, and Metabolism” model; ADAM), GastroPlus (“Advanced Compartmental Absorption Transit” model; ACAT), and PKSIM have been described in detail in the literature.28,29 Such software rely on a variety of in vitro and/or in silico input data such as solubility, permeability, particle size, logP, and pKa to model the kinetics associated with dissolution, precipitation, uptake, and absorption of a compound as it transits through the different segments of the digestive tract.
One of the key input parameters for absorption is a measure of human effective permeability. At early stages of drug discovery, this can be predicted from in silico models or, alternatively, measured in high-throughput assays such as the parallel artificial membrane permeability assay and Ralph Russ canine kidney cells. At more advanced stages, permeability measurements from Caco-2 cell lines are often preferred. To utilize such data in PBPK models it is necessary to scale these in vitro data to the in vivo situation (human effective permeability). The test compound is typically calibrated against a number of reference drugs for which human in vivo jejunal permeability data has been measured.53
Another key input parameter is the in vivo relevant solubility. This value at a given pH can be used to estimate solubility over a range of pH values in the gastrointestinal tract using the compound-specific pKa and pH-partition theory. For highly soluble compounds, aqueous solubility data is predictive of the in vivo situation and can be utilized with confidence in PBPK models. However, for poorly soluble lipophilic compounds, aqueous solubility values tend to underpredict the in vivo dissolution rate where bile salts and lipids can enhance solubilization. In this case, more biorelevant solubility data in media such as fasted state simulating intestinal fluid and fed state simulating intestinal fluid should be generated.54 These solubility measurements have been shown by a number of authors to be essential for reliable PBPK simulation in both animals and human.55,56
PBPK models provide a physiological framework facilitating the incorporation of other mechanisms as appropriate, e.g., active transport processes. Such transport processes may be incorporated in a number of different tissues, e.g., the liver and intestine, if relevant input data are available and may result in higher or lower unbound concentrations of drug as compared with the plasma. In the case of the intestine, parameters describing the kinetics of drug efflux can be obtained from Caco-2 cell systems by incubating the test compound over a range of compound concentrations. These parameters can be scaled to the in vivo situation correcting for the surface area differences in vitro vs. in vivo and used within a PBPK model to simulate the effects of P-glycoprotein on the absorption of the compound. However, such applications are currently limited by the lack of in vitro-in vivo correlation of P-glycoprotein kinetic parameters and rely mainly on “model fitting” rather than “model simulations”.57 In the case of the liver, organic anion transport protein (OATP)-mediated uptake can also be incorporated into the generic PBPK model framework. This is achieved by modeling the liver as a permeability-limited tissue, incorporating active uptake and passive diffusion of unbound drug at the sinusoidal membrane and biliary efflux of unbound drug at the canalicular membrane. Compound-specific parameters to support these models can be estimated from in vitro sandwich-cultured hepatocyte data and scaled to the in vivo situation accounting for hepatocellularity per gram of liver and liver weight as described previously.42 Sandwich-cultured hepatocyte experiments typically measure the increase in “amount” of compound in the hepatocyte over time in the presence and absence of inhibitors/conditions for active uptake and efflux. To determine accurately these transport parameters, particularly biliary efflux, the intracellular concentration of compound must be estimated, hence in vitro models describing the dynamics of the hepatocyte system have been adopted to calculate precisely these in vitro uptake parameters.48,58 Integration of relevant scaled in vitro parameters into PBPK models have been used to simulate in vivo PK for OATP substrates in rat and human. In most cases, successful predictions were only achieved when empirical scaling factors were incorporated.48,58,59
PBPK Modeling Strategy in Drug Discovery and Development
PBPK modeling can be applied in drug discovery and development from the early stages before lead development where limited data are available as well as in early to late drug development, where more data are available. There are now several examples of the use of PBPK models during the drug discovery and development phases for decision-making specific to candidate selection, first-in-human dose, assessment of DDI potential, and definition of appropriate study designs involving DDIs or inclusion/exclusion criteria for studies with drugs metabolized by polymorphic enzymes.24,25,26,32 Throughout drug discovery and development, PBPK models can be refined iteratively to incorporate additional information on drug disposition and absorption from both preclinical and clinical studies as it becomes available. A well-constructed PBPK model can play an important role in the design of preclinical and clinical pharmacology studies. Here, we present strategies for the application of PBPK modeling. Jones et al.22 proposed and validated a strategy for the application of PBPK models in simulations of human PK for new chemical entities. The general approach is described below (Figure 3).
Figure 3.

PBPK modeling strategy in drug discovery and development. An iterative “learn, confirm, and refine” approach to PBPK simulation is recommended. Initially, the PBPK simulation is performed in animals using animal PBPK models, animal in vitro data, and compound-specific physicochemical data. The animal simulation is compared with the in vivo data, if this simulation in animals is reasonable then the healthy volunteer simulation is performed using a human PBPK model built using healthy volunteer physiology, human in vitro data, and compound-specific physicochemical data. These simulations can then be extended to various patient populations using relevant physiology. If the simulation at any stage is inaccurate, this would indicate a violation of one or more of the model assumptions, in this case further experiments may be performed to understand the mismatch. PBPK, physiologically based pharmacokinetics.
Initially, simulations are performed using animal PBPK models, animal in vitro data, and compound-specific physicochemical data. The simulations are then compared with the actual in vivo data. The purpose of this step is to validate the assumptions of the model for the compound of interest. If the simulated profiles are able to recover the in vivo data (visual inspection), simulations are then performed using a human PBPK model, human in vitro data, and compound-specific physicochemical data. If the simulations in animals are not consistent with in vivo data, this may indicate that a biological mechanism affecting the PK of a drug has not been incorporated into the model and is not likely to be represented by the ADME-screening assays. In these cases, PBPK modeling can be used to hypothesize why there is a mismatch between the simulations and actual in vivo data and perhaps guide in the design of further experiments. This approach has been validated independently by a number of groups using diverse drug datasets.22,26 Specific examples of successful prospective predictions of human PK using PBPK modeling can be found in the literature.60,61 These publications provide examples of where PBPK modeling has been used to inform first-in-human clinical trials.
Once this human model has been validated using clinical data, it can be applied prospectively to assess the impact of different dosage regimens or the DDI potential of the compound as a victim or perpetrator. The predictions can then be compared with observed data as actual data become available. If there is any inconsistency, both the clinical data and in vitro data can be reviewed to ascertain whether there is a missing component of the model (e.g., autoinhibition which may lead to dose nonlinearity) or whether there is an issue with one of the in vitro parameters (e.g., underestimation of CLint leading to underprediction of clearance). Although in vitro data provide an indication of the key components that should be built into a model, clinical data are also a source of information. For example, single ascending dose data and multiple ascending dose data can indicate whether dose- or time-dependent kinetics are an issue. In addition, clinical DDI data can be used to assess the robustness of the fm value of the victim drug (the fraction metabolized by the inhibited enzyme), an important parameter for the prediction of DDIs. Once the “missing component” or “erroneous parameter” (Parameter X) has been identified, a “top-down” fitting approach can be integrated with a “bottom-up” approach to obtain an estimate of Parameter X. Clinical data (e.g., plasma concentration–time profile) can be combined with IVIVE of all prior in vitro data to fit iteratively for Parameter X using a least squares fitting algorithm until the simulated concentration–time profiles are consistent with the clinical data. The PBPK model is then validated to ensure that inclusion of Parameter X allows recovery of the observed data. The latter should be taken from independent validation sets i.e., clinical data that have not been used for development of the original model.18 If the model is not able to recover the observed data, then the model should be revised accordingly. This iterative procedure is captured in the article by Vieira et al.62 and in Figure 3. This is probably more applicable at later stages of drug development, where the ultimate aim is to develop a PBPK model that can recover all of the clinical scenarios, thus ensuring that all of the relevant mechanistic components have been integrated.
Despite the recent progress in incorporating transporters into PBPK models and predicting transporter-mediated DDIs, many challenges remain to be elucidated. For example, there are issues with the in vitro systems and the physiological limitations in mimicking the in vivo situation. This includes the interplay between enzymes and transporters and the possible compensatory increase in activities of one or more other transporters when the activity of a transporter is suppressed. Recent publications have indicated that when transporter-mediated uptake is involved in the disposition of a compound, a “top-down/bottom-up” fitting approach is required to allow recovery of clinical data.48,63,64
To facilitate and accelerate the model building, if clinical data are available for a number of subjects, it is possible to use population PK analysis, including Maximum Likelihood or Bayesian methodology, to obtain best estimates of the parameter. Bayesian methods extend the Maximum Likelihood approach by incorporating prior distributions, on the various unknown parameters, including in vitro data or clinical trial data. Therefore, Bayesian approaches have emerged as the best-suited one for PBPK models, given the large amount of prior information they incorporate.65
A view held by many within pharmaceutical companies appears to be that if PBPK models are developed and validated using some clinical data, they can be applied prospectively to predict DDIs, with the ultimate aim of having a clinical DDI study waived by the regulatory authorities. One of the problems with this approach is that it then begs the question of how reliable is the model? Of course, this then becomes a circular argument in that the robustness of the model is brought into question as there are no clinical DDI data to support it. Having to conduct clinical DDI studies does not negate the impact of PBPK models in the drug development process; it only serves to enhance them. As described previously, these data can be used to ensure that the PBPK model is robust. The refined and validated model can then be used to predict PK and DDIs prospectively in individuals at extreme risk or in subjects who for ethical reasons cannot be investigated in formal clinical trials.
Building in “system” properties to PBPK models allows for quantitative assessment of the impact of covariates, such as ethnicity, genetics, age, liver disease, renal impairment, and ontogeny on physiological parameters such as CYP abundance, microsomal protein per gram of liver, and liver volume. Therefore, once a PBPK model has been developed and validated in a healthy volunteer population, simulations can be run in the target population using relevant “system” parameters (Figure 3). If databases are not readily available for the population of interest, one can be constructed if the etiology of the disease is known. With the apparent regulatory acceptance of this approach,66 the use of PBPK models for predicting PK exposure in special populations is increasing. Indeed, current regulatory guidelines on PK in patients with hepatic impairment recommend the development of PBPK models.12 Furthermore, the requirement to submit a pediatric investigation plan before completion of the Phase I trial has led many companies to use PBPK techniques to predict PK and set doses in children.
Examples of Application of PBPK Modeling
Example 1: Discovery and early development stage
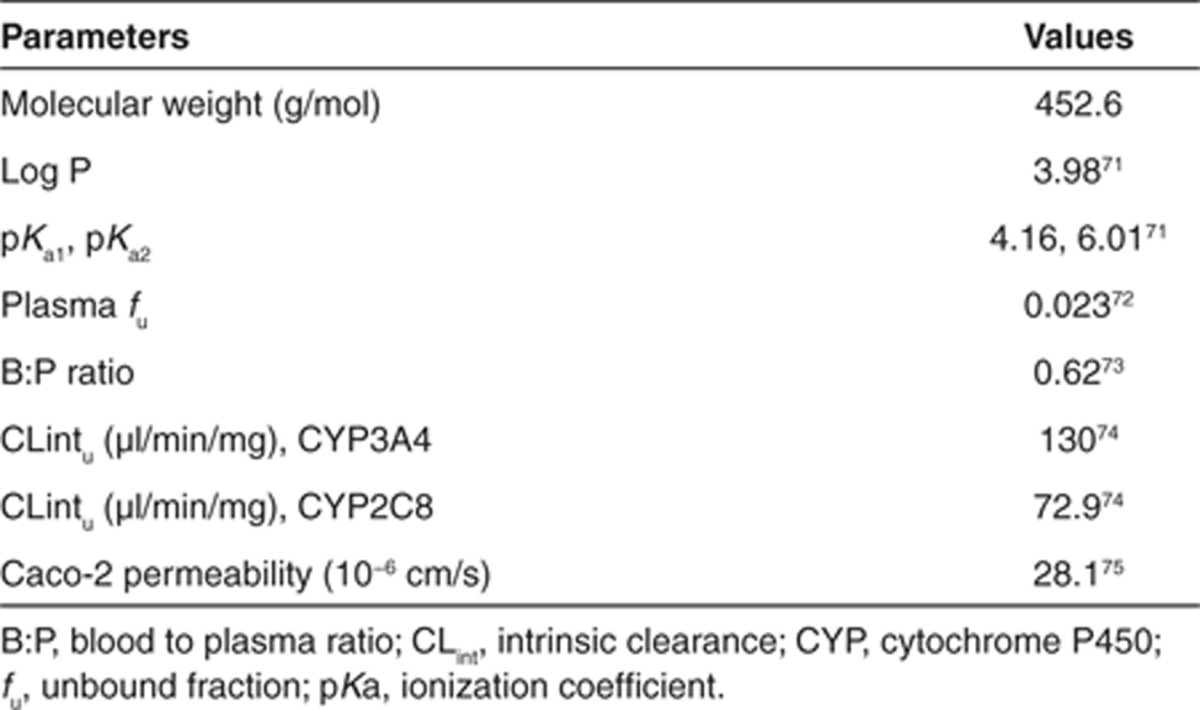
A “real life” example of the use of PBPK modeling for prospective prediction of human PK is described here. Compound X is a moderately lipophilic, weak base, with good permeability and moderate solubility. Preclinical in vitro and in vivo studies indicate that compound X is mainly cleared via CYP450. The available physicochemical and in vitro properties are shown in Table 1.
Table 1. PBPK-specific input parameters for compound X.
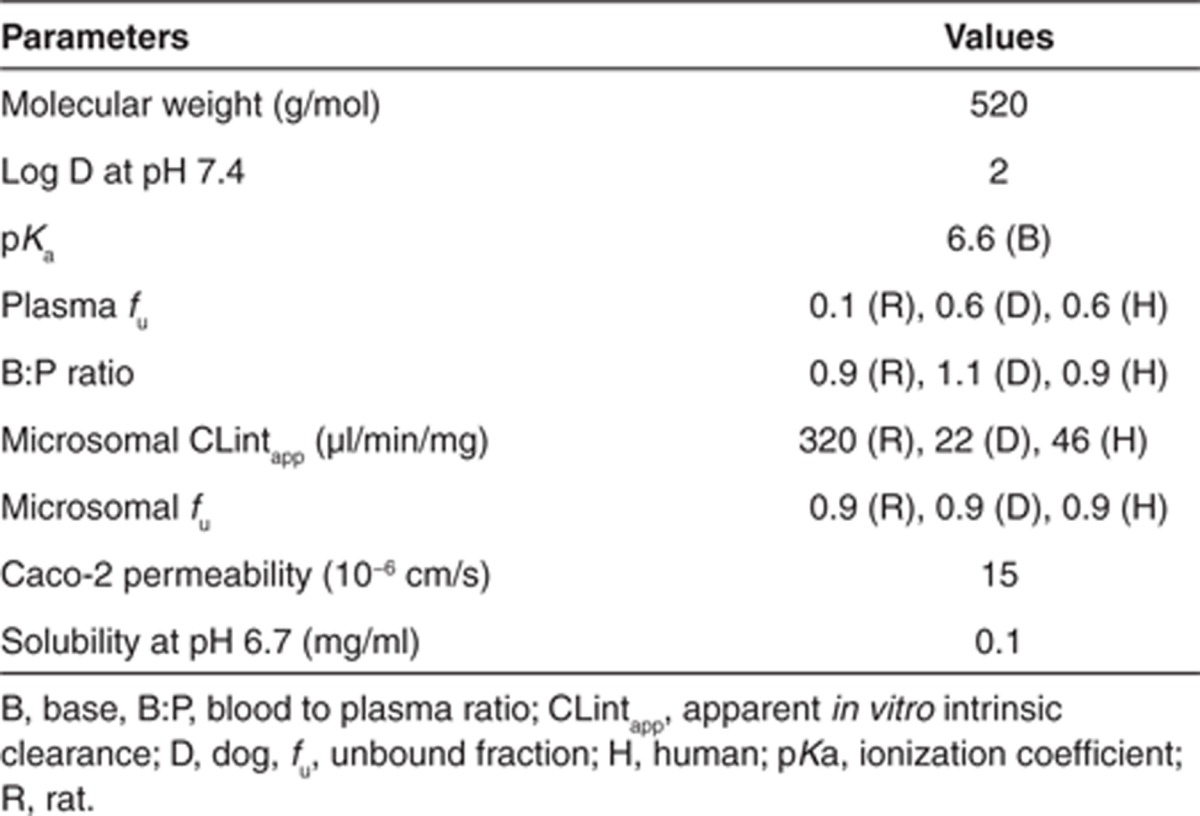
The PBPK model and assumptions were initially validated in rats and dogs following i.v. and oral administration. As can be seen in Figure 4a,b, the i.v. plasma concentration–time profile in rat and dog is reasonably well predicted from the PBPK model, indicating the assumptions of CYP metabolism (as predicted from rat and dog liver microsomes, respectively) and passive, perfusion-limited distribution (using Kp values predicted from tissue composition equations);10 are valid. In addition, the predicted PK parameters (CL and Vss) compare very well with the observed data (Table 2).
Figure 4.

Observed vs. predicted plasma concentration–time profiles in rat, dog, and human. (a) Rat i.v. (1 mg/kg); (b) Dog i.v. (0.5 mg/kg); (c) = Rat oral (2 mg/kg); (d) Dog oral (1 mg/kg); (e) Human oral (100 mg). Simulations were performed using the SimCYP Population-Based Simulator. In a–d: open squares = observed data; solid line = model prediction; In e: open squares = mean observed data ± SD; solid line = mean model prediction; dashed line = model predicted 5 and 95 percentiles. i.v., intravenous.
Table 2. Observed vs. predicted PK parameters for compound X.
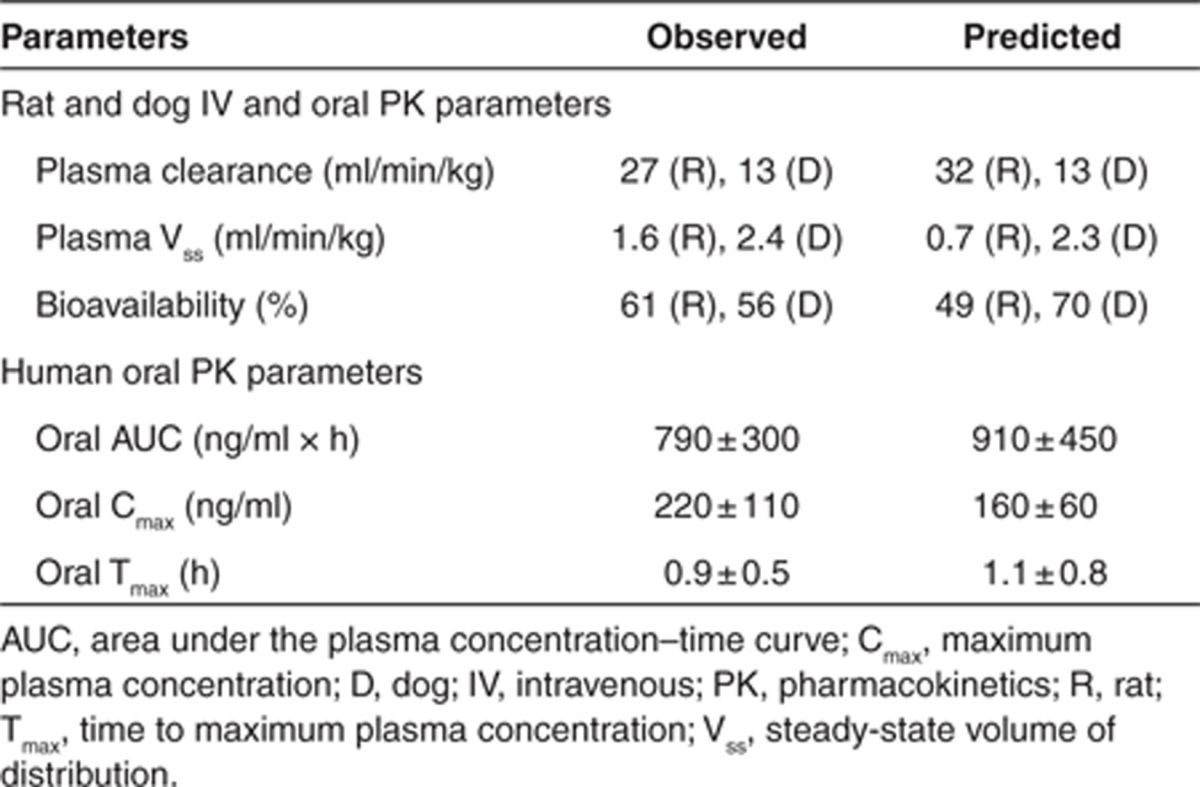
To assess the validity of the absorption component of the model and its assumptions, the i.v. model was optimized to match accurately the observed i.v. data and the Caco-2 permeability, and aqueous solubility data were used to simulate the absorption. Under this scenario, the PBPK model was able to accurately capture the observed oral plasma concentration–time profile in both the species correctly (Figure 4c,d) indicating the assumption of passive absorption is valid for this compound. In addition, using the predicted absorption and clearance, the bioavailability was accurately estimated. This initial validation in rat and dog provides confidence in the model assumptions and predictability before the human simulation.
A simulation was performed in human at the proposed efficacious dose of 100 mg, applying the same assumptions as were used in rat and dog i.e., CYP450-mediated metabolism (as predicted from human liver microsomes), passive, perfusion-limited distribution (using Kp values predicted from tissue composition equations);10 and passive absorption using the ADAM model (using Caco-2 and solubility data as input). As can be seen in Figure 4e, the simulated oral plasma concentration–time profile (mean and 5 and 95 percentiles) capture well the observed data. The oral PK parameters were also well predicted with the model (Table 2). During drug discovery, application of such a modeling approach allows for early assessment of compound viability. While during the early stages of drug development, the model can be extended to predict a wider dose range to help design the clinical study and dose escalation procedure as well as explore food effects and possible DDIs.
Example 2: Clinical development stage
Here, we describe an approach that can be used when both the clinical and in vitro data are available, but there is uncertainty regarding a particular parameter that is inherent to the PBPK model. Repaglinide, a short-acting meglitinide analogue antidiabetic drug, is used in the treatment of type 2 diabetes mellitus. Following oral administration, the drug is rapidly absorbed and undergoes first pass metabolism resulting in a bioavailability of 60%. CYP3A4 and CYP2C8 are the main enzymes responsible for the oxidative metabolism of the compound. There is strong clinical evidence to indicate that repaglinide is a substrate of the SLCO1B1-encoded hepatic uptake transporter OATP1B1. However, at the time of the development of this model, there were no in vitro data for OATP1B1-mediated uptake of repaglinide into the liver. Prior in vitro information on the physicochemical parameters, metabolism, and kinetics of repaglinide are shown in Table 3.
Table 3. PBPK-specific input parameters for repaglinide.
These data were used to drive the PBPK model, assuming permeability-limited distribution in the liver. A “top-down” fitting approach (mean concentration–time profile) of repaglinide from the study reported by Niemi et al.,67 was combined with “bottom-up” extrapolation of all prior in vitro data to obtain an estimate of 282 μl/min/million cells for the OATP1B1-mediated hepatic uptake CLint of repaglinide. Simulations including the hepatic uptake via OATP1B1 were able to recover observed data at several different doses (Step A; Figure 5). In order to establish that the relative contributions of CYP2C8, CYP3A4, and OATP1B1 to the disposition of repaglinide were appropriate, DDIs were simulated using the inhibitors trimethoprim (CYP2C8), clarithromycin (CYP3A4), and cyclosporine (OATP1B1), and compared with observed data. Before this, simulated concentration–time profiles of each of the inhibitors were run to ensure that the PBPK models for each of the inhibitors could recover the observed profiles (Step B; Figure 5). In addition, these compound files were validated to ensure that they could be used to accurately predict DDIs with probe substrates including midazolam (CYP3A4), rosiglitazone (CYP2C8), and rosuvastatin (OATP1B1). Thus, even when investigating a single DDI pair, a matrix of interactions should be investigated to ensure that all components of the PBPK models are robust. On average, predicted increases in area under the plasma concentration–time curve of repaglinide during coadministration of trimethoprim (1.3-fold; 160 mg q.d.), clarithromycin (1.4-fold; 250 mg b.i.d.), and cyclosporine (twofold; 100 mg b.i.d.) were consistent with observed values of 1.6-, 1.4-, and 2.4-fold, respectively (Step C; Figure 5). Although only changes in plasma concentrations are presented here, the full PBPK model can be used to predict the impact of the DDI on the exposure of repaglinide in the pancreas, which in this case, is the site of action. The simulated pancreas concentrations can then be used to drive the response which can be investigated by application of a PD model.
Figure 5.

PBPK modeling strategy for prediction of DDIs. C (green) = clarithromycin; T (red) = trimethoprim; CY (yellow) = cyclosporine. Step A refers to the development of the initial substrate model using a combination of “top-down/bottom-up” approaches. Assessment of model accuracy via simulation and recovery of known DDI studies is then required to confirm the relative contribution of CYP and OATP components. Step B refers to validation of the inhibitor models before simulation of the DDIs by performing a comparison of simulated and observed profiles. Step C refers to simulation of the DDIs using validated substrate and inhibitor models to confirm that the final substrate model is able to recover the observed DDIs. AUC, area under the plasma concentration–time curve; CYP, cytochrome P450; DDI, drug–drug interaction; OATP, organic anion transport protein; PBPK, PBPK, physiologically based pharmacokinetics.
PBPK models incorporating transporters and CYP enzymes as well as other intrinsic and extrinsic patient factors are required for assessment of an individual's risk of DDIs, especially those involving multiple inhibitors. This is of particular concern for regulatory agencies. It is not possible to conduct all possible combinations of in vivo studies. Simulations can be used to assess the worst-case combination(s) for clinical evaluation. This is most likely to involve the combination of drugs that inhibit different enzymes or transporters such that the effects are more than additive, such as the example shown here. Coadministration of all three inhibitors with repaglinide in our virtual clinical trial was associated with a 5.6-fold increase in area under the plasma concentration–time curve on average (Figure 5), but values ranged from 2.3- to 18-fold in the virtual population. Although there were no clinical data to confirm whether the predicted magnitude of interaction for the complex DDI involving inhibition of CYP2C8, CYP3A4, and OATP1B1-mediated uptake was accurate, the fact that the PBPK model was able to recover observed data for each of the clinical DDIs involving a single inhibitor provides some confidence in its accuracy.
Future Perspectives
While it is encouraging to observe that PBPK models are being increasingly used by the pharmaceutical industry for prediction of PK, it has become apparent that some major challenges remain that need to be addressed to increase the success of this approach. There are many “system parameters” that are lacking such as abundances of enzymes and transporters and other relevant proteins. Information on physiology and biology in different ethnic populations and disease groups is also scarce. Despite this, efforts have been more focused on the refinement of in vitro systems and related methodology for accurate prediction of the drug ADME parameters. This is particularly the case for low clearance compounds as it is difficult to measure depletion rates in human liver tissues using current techniques.68 With efforts to produce compounds that are more metabolically stable, transporter-mediated PK is becoming more prevalent. Despite recent progress at incorporating transporters into PBPK models,48,58,59 it has been recognized that there are issues with the in vitro systems and the physiological limitations in mimicking the in vivo situation and more needs to be done. Economic constraints within the pharmaceutical industry have led to growth in precompetitive research collaborations which may help to resolve such issues and also lead to an increase in the availability of “system parameters”, as the resource issue can be shared among interested parties.
Future developments include combining PBPK models with fully mechanistic PD models and variability in pharmacological response (including receptor genotype). In addition, systems pharmacology is likely to be considered as the next frontier of PK/PD, in which mechanistic detail can be incorporated in every step of the way, leading from dose to exposure (PBPK models) to response (PD models).69 This can perhaps be viewed as the first step toward the provision of “personalized medicine”. Indeed, at some stage in the future, it may be possible to predict drug PK, efficacy, and side effects in a given individual with a known genotypic make-up for relevant ADME and pharmacology proteins. Another development includes the routine application of PBPK models to predict the disposition of large molecules.70 Commercial platforms with integrated PBPK models, which are applied through the pharmaceutical industry, are continuously being updated to incorporate these scientific developments. Therefore, users have to receive sufficient education on the science that is being implemented as well as training on the software functionality. This can be provided in the form of workshops or perhaps even be taught in an academic environment in a relevant disciplinized way. Having said that, experience counts for everything. In the pharmaceutical industry, dedicated users should be assigned to develop and retain the skill sets required for application of the PBPK models. As a result of the multidisciplinary aspects of PBPK modeling, users tend to have a wide variety of backgrounds, including drug metabolism, pharmacology, medicine, pharmacy, biophysics, engineering, mathematics, programming, and statistics. Therefore, it is important to facilitate communication across the disciplines.
Conclusions
There is no doubt that the use of PBPK modeling to maximize the clinical potential of drugs has been accepted by the pharmaceutical industry and regulatory agencies, and thus, is likely to be applied even more widely. PBPK modeling is already considered to be complex and data intensive. As our knowledge of physiology and biochemical processes improves, especially in different disease states, even more sophisticated models will be developed. Therefore, regardless of the level of expertise of the user, PBPK modeling requires continuous education as the models evolve. The use of PBPK modeling in drug development requires adequate resources and individuals need sufficient training in application of the models as well as a good understanding of the ADME data required to drive the models. Good communication between individuals in preclinical drug discovery and clinical drug development facilitates the provision of robust PBPK models that can then be applied prospectively to answer many questions relevant to the drug development process.
Conflict of interest
H.M.J. is an employee of Pfizer Inc. K.R.-Y. is an employee of Simcyp Ltd.
Acknowledgments
The authors thank James Kay for his assistance in preparing the manuscript.
Supplementary Material
References
- Mitragotri S., et al. Mathematical models of skin permeability: an overview. Int. J. Pharm. 2011;418:115–129. doi: 10.1016/j.ijpharm.2011.02.023. [DOI] [PubMed] [Google Scholar]
- Gabrielsson J., Weiner D.Pharmacokinetic and Pharmacodynamic Data Analysis: Concepts and Applications4th edn. (Swedish Pharmaceutical Press, Stockholm, Sweden; 2007 [Google Scholar]
- Rowland Yeo K., Aarabi M., Jamei M., Rostami-Hodjegan A. Modeling and predicting drug pharmacokinetics in patients with renal impairment. Expert Rev. Clin. Pharmacol. 2011;4:261–274. doi: 10.1586/ecp.10.143. [DOI] [PubMed] [Google Scholar]
- Rostami-Hodjegan A. Physiologically based pharmacokinetics joined with in vitro-in vivo extrapolation of ADME: a marriage under the arch of systems pharmacology. Clin. Pharmacol. Ther. 2012;92:50–61. doi: 10.1038/clpt.2012.65. [DOI] [PubMed] [Google Scholar]
- Teorell T. Studies on the diffusion effect upon ionic distribution: II. Experiments on ionic accumulation. J. Gen. Physiol. 1937;21:107–122. doi: 10.1085/jgp.21.1.107. [DOI] [PMC free article] [PubMed] [Google Scholar]
- Bischoff K.B., Dedrick R.L., Zaharko D.S., Longstreth J.A. Methotrexate pharmacokinetics. J. Pharm. Sci. 1971;60:1128–1133. doi: 10.1002/jps.2600600803. [DOI] [PubMed] [Google Scholar]
- Nestorov I. Whole-body physiologically based pharmacokinetic models. Expert Opin. Drug Metab. Toxicol. 2007;3:235–249. doi: 10.1517/17425255.3.2.235. [DOI] [PubMed] [Google Scholar]
- Tanaka C., Kawai R., Rowland M. Dose-dependent pharmacokinetics of cyclosporin A in rats: events in tissues. Drug Metab. Dispos. 2000;28:582–589. [PubMed] [Google Scholar]
- Poulin P., Theil F.P. Prediction of pharmacokinetics prior to in vivo studies. 1. Mechanism-based prediction of volume of distribution. J. Pharm. Sci. 2002;91:129–156. doi: 10.1002/jps.10005. [DOI] [PubMed] [Google Scholar]
- Berezhkovskiy L.M. Determination of volume of distribution at steady state with complete consideration of the kinetics of protein and tissue binding in linear pharmacokinetics. J. Pharm. Sci. 2004;93:364–374. doi: 10.1002/jps.10539. [DOI] [PubMed] [Google Scholar]
- Rodgers T., Rowland M. Mechanistic approaches to volume of distribution predictions: understanding the processes. Pharm. Res. 2007;24:918–933. doi: 10.1007/s11095-006-9210-3. [DOI] [PubMed] [Google Scholar]
- Rowland M., Peck C., Tucker G. Physiologically-based pharmacokinetics in drug development and regulatory science. Annu. Rev. Pharmacol. Toxicol. 2011;51:45–73. doi: 10.1146/annurev-pharmtox-010510-100540. [DOI] [PubMed] [Google Scholar]
- Pang K.S., Durk M.R. Physiologically-based pharmacokinetic modeling for absorption, transport, metabolism and excretion. J. Pharmacokinet. Pharmacodyn. 2010;37:591–615. doi: 10.1007/s10928-010-9185-x. [DOI] [PubMed] [Google Scholar]
- Fenneteau F., Poulin P., Nekka F. Physiologically based predictions of the impact of inhibition of intestinal and hepatic metabolism on human pharmacokinetics of CYP3A substrates. J. Pharm. Sci. 2010;99:486–514. doi: 10.1002/jps.21802. [DOI] [PubMed] [Google Scholar]
- Huang S.M., Abernethy D.R., Wang Y., Zhao P., Zineh I. J. Pharm. Sci. e-pub ahead of print 24 May 2013; 2013. The utility of modeling and simulation in drug development and regulatory review. [DOI] [PubMed] [Google Scholar]
- Guidance for Industry Drug Interaction Studies - Study Design, Data Analysis, Implications for Dosing, and Labeling Recommendations Food and Drug Admininstration, US Department of Health and Human Services February 2012 < < http://www.fda.gov/downloads /Drugs/GuidanceComplianceRegulatoryInformation/ Guidances/ucm292362.pdf >. Accessed 01 April 2012.
- Guideline on the Investigation of Drug Interactions European Medicines Agency 2012 < http://www.ema.europa.eu/docs/en_GB/ document_library/Serennac_guideline/ 2012/07/wcs00129606.pdf >. Accessed 27 November 2012.
- Zhao P., Rowland M., Huang S.M. Best practice in the use of physiologically based pharmacokinetic modeling and simulation to address clinical pharmacology regulatory questions. Clin. Pharmacol. Ther. 2012;92:17–20. doi: 10.1038/clpt.2012.68. [DOI] [PubMed] [Google Scholar]
- Nestorov I.A., Aarons L.J., Arundel P.A., Rowland M. Lumping of whole-body physiologically based pharmacokinetic models. J. Pharmacokinet. Biopharm. 1998;26:21–46. doi: 10.1023/a:1023272707390. [DOI] [PubMed] [Google Scholar]
- Rowland Yeo K., Jamei M., Yang J., Tucker G.T., Rostami-Hodjegan A. Physiologically based mechanistic modelling to predict complex drug-drug interactions involving simultaneous competitive and time-dependent enzyme inhibition by parent compound and its metabolite in both liver and gut - the effect of diltiazem on the time-course of exposure to triazolam. Eur. J. Pharm. Sci. 2010;39:298–309. doi: 10.1016/j.ejps.2009.12.002. [DOI] [PubMed] [Google Scholar]
- Blakey G.E., Nestorov I.A., Arundel P.A., Aarons L.J., Rowland M. Quantitative structure-pharmacokinetics relationships: I. Development of a whole-body physiologically based model to characterize changes in pharmacokinetics across a homologous series of barbiturates in the rat. J. Pharmacokinet. Biopharm. 1997;25:277–312. doi: 10.1023/a:1025771608474. [DOI] [PubMed] [Google Scholar]
- Jones H.M., Parrott N., Jorga K., Lavé T. A novel strategy for physiologically based predictions of human pharmacokinetics. Clin. Pharmacokinet. 2006;45:511–542. doi: 10.2165/00003088-200645050-00006. [DOI] [PubMed] [Google Scholar]
- Jones H.M., et al. Simulation of human intravenous and oral pharmacokinetics of 21 diverse compounds using physiologically based pharmacokinetic modelling. Clin. Pharmacokinet. 2011;50:331–347. doi: 10.2165/11539680-000000000-00000. [DOI] [PubMed] [Google Scholar]
- Sinha V.K., Snoeys J., Osselaer N.V., Peer A.V., Mackie C., Heald D. From preclinical to human–prediction of oral absorption and drug-drug interaction potential using physiologically based pharmacokinetic (PBPK) modeling approach in an industrial setting: a workflow by using case example. Biopharm. Drug Dispos. 2012;33:111–121. doi: 10.1002/bdd.1782. [DOI] [PubMed] [Google Scholar]
- Chen Y., Jin J.Y., Mukadam S., Malhi V., Kenny J.R. Application of IVIVE and PBPK modeling in prospective prediction of clinical pharmacokinetics: strategy and approach during the drug discovery phase with four case studies. Biopharm. Drug Dispos. 2012;33:85–98. doi: 10.1002/bdd.1769. [DOI] [PubMed] [Google Scholar]
- De Buck S.S., Sinha V.K., Fenu L.A., Nijsen M.J., Mackie C.E., Gilissen R.A. Prediction of human pharmacokinetics using physiologically based modeling: a retrospective analysis of 26 clinically tested drugs. Drug Metab. Dispos. 2007;35:1766–1780. doi: 10.1124/dmd.107.015644. [DOI] [PubMed] [Google Scholar]
- Sugano K. Introduction to computational oral absorption simulation. Expert Opin. Drug Metab. Toxicol. 2009;5:259–293. doi: 10.1517/17425250902835506. [DOI] [PubMed] [Google Scholar]
- Agoram B., Woltosz W.S., Bolger M.B. Predicting the impact of physiological and biochemical processes on oral drug bioavailability. Adv. Drug Deliv. Rev. 2001;50 suppl. 1:S41–S67. doi: 10.1016/s0169-409x(01)00179-x. [DOI] [PubMed] [Google Scholar]
- Willmann S., Schmitt W., Keldenich J., Lippert J., Dressman J.B. A physiological model for the estimation of the fraction dose absorbed in humans. J. Med. Chem. 2004;47:4022–4031. doi: 10.1021/jm030999b. [DOI] [PubMed] [Google Scholar]
- Jamei M., et al. Population-based mechanistic prediction of oral drug absorption. AAPS J. 2009;11:225–237. doi: 10.1208/s12248-009-9099-y. [DOI] [PMC free article] [PubMed] [Google Scholar]
- Brown R.P., Delp M.D., Lindstedt S.L., Rhomberg L.R., Beliles R.P. Physiological parameter values for physiologically based pharmacokinetic models. Toxicol. Ind. Health. 1997;13:407–484. doi: 10.1177/074823379701300401. [DOI] [PubMed] [Google Scholar]
- Edginton A.N., Willmann S. Physiology-based simulations of a pathological condition: prediction of pharmacokinetics in patients with liver cirrhosis. Clin. Pharmacokinet. 2008;47:743–752. doi: 10.2165/00003088-200847110-00005. [DOI] [PubMed] [Google Scholar]
- Johnson T.N., Boussery K., Rowland-Yeo K., Tucker G.T., Rostami-Hodjegan A. A semi-mechanistic model to predict the effects of liver cirrhosis on drug clearance. Clin. Pharmacokinet. 2010;49:189–206. doi: 10.2165/11318160-000000000-00000. [DOI] [PubMed] [Google Scholar]
- Thompson C.M., et al. Database for physiologically based pharmacokinetic (PBPK) modeling: physiological data for healthy and health-impaired elderly. J. Toxicol. Environ. Health. B. Crit. Rev. 2009;12:1–24. doi: 10.1080/10937400802545060. [DOI] [PubMed] [Google Scholar]
- Johnson T.N., Rostami-Hodjegan A., Tucker G.T. Prediction of the clearance of eleven drugs and associated variability in neonates, infants and children. Clin. Pharmacokinet. 2006;45:931–956. doi: 10.2165/00003088-200645090-00005. [DOI] [PubMed] [Google Scholar]
- Abduljalil K., Furness P., Johnson T.N., Rostami-Hodjegan A., Soltani H. Anatomical, physiological and metabolic changes with gestational age during normal pregnancy: a database for parameters required in physiologically based pharmacokinetic modelling. Clin. Pharmacokinet. 2012;51:365–396. doi: 10.2165/11597440-000000000-00000. [DOI] [PubMed] [Google Scholar]
- Ghobadi C., et al. Application of a systems approach to the bottom-up assessment of pharmacokinetics in obese patients: expected variations in clearance. Clin. Pharmacokinet. 2011;50:809–822. doi: 10.2165/11594420-000000000-00000. [DOI] [PubMed] [Google Scholar]
- Plowchalk D.R., Rowland Yeo K. Prediction of drug clearance in a smoking population: modeling the impact of variable cigarette consumption on the induction of CYP1A2. Eur. J. Clin. Pharmacol. 2012;68:951–960. doi: 10.1007/s00228-011-1189-y. [DOI] [PubMed] [Google Scholar]
- Jamei M., Dickinson G.L., Rostami-Hodjegan A. A framework for assessing inter-individual variability in pharmacokinetics using virtual human populations and integrating general knowledge of physical chemistry, biology, anatomy, physiology and genetics: A tale of ‘bottom-up' vs ‘top-down' recognition of covariates. Drug Metab. Pharmacokinet. 2009;24:53–75. doi: 10.2133/dmpk.24.53. [DOI] [PubMed] [Google Scholar]
- Jamei M., Marciniak S., Feng K., Barnett A., Tucker G., Rostami-Hodjegan A. The Simcyp population-based ADME simulator. Expert Opin. Drug Metab. Toxicol. 2009;5:211–223. doi: 10.1517/17425250802691074. [DOI] [PubMed] [Google Scholar]
- Hallifax D., Foster J.A., Houston J.B. Prediction of human metabolic clearance from in vitro systems: retrospective analysis and prospective view. Pharm. Res. 2010;27:2150–2161. doi: 10.1007/s11095-010-0218-3. [DOI] [PubMed] [Google Scholar]
- Houston J.B. Utility of in vitro drug metabolism data in predicting in vivo metabolic clearance. Biochem. Pharmacol. 1994;47:1469–1479. doi: 10.1016/0006-2952(94)90520-7. [DOI] [PubMed] [Google Scholar]
- Rostami-Hodjegan A., Tucker G.T. Simulation and prediction of in vivo drug metabolism in human populations from in vitro data. Nat. Rev. Drug Discov. 2007;6:140–148. doi: 10.1038/nrd2173. [DOI] [PubMed] [Google Scholar]
- Shiran M.R., Proctor N.J., Howgate E.M., Rowland-Yeo K., Tucker G.T., Rostami-Hodjegan A. Prediction of metabolic drug clearance in humans: in vitro-in vivo extrapolation vs allometric scaling. Xenobiotica. 2006;36:567–580. doi: 10.1080/00498250600761662. [DOI] [PubMed] [Google Scholar]
- Mahmood I., Sahajwalla C. Interspecies scaling of biliary excreted drugs. J. Pharm. Sci. 2002;91:1908–1914. doi: 10.1002/jps.10174. [DOI] [PubMed] [Google Scholar]
- Paine S.W., Ménochet K., Denton R., McGinnity D.F., Riley R.J. Prediction of human renal clearance from preclinical species for a diverse set of drugs that exhibit both active secretion and net reabsorption. Drug Metab. Dispos. 2011;39:1008–1013. doi: 10.1124/dmd.110.037267. [DOI] [PubMed] [Google Scholar]
- Bi Y.A., Kazolias D., Duignan D.B. Use of cryopreserved human hepatocytes in sandwich culture to measure hepatobiliary transport. Drug Metab. Dispos. 2006;34:1658–1665. doi: 10.1124/dmd.105.009118. [DOI] [PubMed] [Google Scholar]
- Jones H.M., et al. Mechanistic pharmacokinetic modeling for the prediction of transporter-mediated disposition in humans from sandwich culture human hepatocyte data. Drug Metab. Dispos. 2012;40:1007–1017. doi: 10.1124/dmd.111.042994. [DOI] [PubMed] [Google Scholar]
- Schmitt W. General approach for the calculation of tissue to plasma partition coefficients. Toxicol. In Vitro. 2008;22:457–467. doi: 10.1016/j.tiv.2007.09.010. [DOI] [PubMed] [Google Scholar]
- Peyret T., Poulin P., Krishnan K. A unified algorithm for predicting partition coefficients for PBPK modeling of drugs and environmental chemicals. Toxicol. Appl. Pharmacol. 2010;249:197–207. doi: 10.1016/j.taap.2010.09.010. [DOI] [PubMed] [Google Scholar]
- Graham H., Walker M., Jones O., Yates J., Galetin A., Aarons L. Comparison of in-vivo and in-silico methods used for prediction of tissue: plasma partition coefficients in rat. J. Pharm. Pharmacol. 2012;64:383–396. doi: 10.1111/j.2042-7158.2011.01429.x. [DOI] [PubMed] [Google Scholar]
- Poulin P., Theil F.P. Development of a novel method for predicting human volume of distribution at steady-state of basic drugs and comparative assessment with existing methods. J. Pharm. Sci. 2009;98:4941–4961. doi: 10.1002/jps.21759. [DOI] [PubMed] [Google Scholar]
- Lennernäs H. Human intestinal permeability. J. Pharm. Sci. 1998;87:403–410. doi: 10.1021/js970332a. [DOI] [PubMed] [Google Scholar]
- Jantratid E., Janssen N., Reppas C., Dressman J.B. Dissolution media simulating conditions in the proximal human gastrointestinal tract: an update. Pharm. Res. 2008;25:1663–1676. doi: 10.1007/s11095-008-9569-4. [DOI] [PubMed] [Google Scholar]
- Parrott N., Lukacova V., Fraczkiewicz G., Bolger M.B. Predicting pharmacokinetics of drugs using physiologically based modeling–application to food effects. AAPS J. 2009;11:45–53. doi: 10.1208/s12248-008-9079-7. [DOI] [PMC free article] [PubMed] [Google Scholar]
- Jones H.M., Parrott N., Ohlenbusch G., Lavé T. Predicting pharmacokinetic food effects using biorelevant solubility media and physiologically based modelling. Clin. Pharmacokinet. 2006;45:1213–1226. doi: 10.2165/00003088-200645120-00006. [DOI] [PubMed] [Google Scholar]
- Watson K.J., Davis J., Jones H.M. Application of physiologically based pharmacokinetic modeling to understanding the clinical pharmacokinetics of UK-369,003. Drug Metab. Dispos. 2011;39:1203–1213. doi: 10.1124/dmd.111.038224. [DOI] [PubMed] [Google Scholar]
- Poirier A., Cascais A.C., Funk C., Lavé T. Prediction of pharmacokinetic profile of valsartan in humans based on in vitro uptake-transport data. Chem. Biodivers. 2009;6:1975–1987. doi: 10.1002/cbdv.200900116. [DOI] [PubMed] [Google Scholar]
- Watanabe T., Kusuhara H., Maeda K., Shitara Y., Sugiyama Y. Physiologically based pharmacokinetic modeling to predict transporter-mediated clearance and distribution of pravastatin in humans. J. Pharmacol. Exp. Ther. 2009;328:652–662. doi: 10.1124/jpet.108.146647. [DOI] [PubMed] [Google Scholar]
- Bungay P.J., Tweedy S., Howe D.C., Gibson K.R., Jones H.M., Mount N.M. Preclinical and clinical pharmacokinetics of PF-02413873, a nonsteroidal progesterone receptor antagonist. Drug Metab. Dispos. 2011;39:1396–1405. doi: 10.1124/dmd.110.037234. [DOI] [PubMed] [Google Scholar]
- Yamazaki S., et al. Prediction of oral pharmacokinetics of cMet kinase inhibitors in humans: physiologically based pharmacokinetic model versus traditional one-compartment model. Drug Metab. Dispos. 2011;39:383–393. doi: 10.1124/dmd.110.035857. [DOI] [PubMed] [Google Scholar]
- Vieira M.L., et al. Predicting drug interaction potential with a physiologically based pharmacokinetic model: a case study of telithromycin, a time-dependent CYP3A inhibitor. Clin. Pharmacol. Ther. 2012;91:700–708. doi: 10.1038/clpt.2011.305. [DOI] [PubMed] [Google Scholar]
- Varma M.V., Lai Y., Feng B., Litchfield J., Goosen T.C., Bergman A. Physiologically based modeling of pravastatin transporter-mediated hepatobiliary disposition and drug-drug interactions. Pharm. Res. 2012;29:2860–2873. doi: 10.1007/s11095-012-0792-7. [DOI] [PubMed] [Google Scholar]
- Rowland-Yeo K., Jamei M., Aarabi M., Rostami-Hodjegan A. Application of physiologically based pharmacokinetic (PBPK) modelling for prediction of complex drug-drug interactions (DDIs) involving OATP1B1-mediated uptake and cytochrome P450 (CYP) metabolism and multiple inhibitors. Clin. Pharmacol. Ther. 2012;91:S47–S48. [Google Scholar]
- Gelman A., Rubin D.B. Markov chain Monte Carlo methods in biostatistics. Stat. Methods Med. Res. 1996;5:339–355. doi: 10.1177/096228029600500402. [DOI] [PubMed] [Google Scholar]
- Huang S.M., Rowland M. The role of physiologically based pharmacokinetic modeling in regulatory review. Clin. Pharmacol. Ther. 2012;91:542–549. doi: 10.1038/clpt.2011.320. [DOI] [PubMed] [Google Scholar]
- Niemi M., Kajosaari L.I., Neuvonen M., Backman J.T., Neuvonen P.J. The CYP2C8 inhibitor trimethoprim increases the plasma concentrations of repaglinide in healthy subjects. Br. J. Clin. Pharmacol. 2004;57:441–447. doi: 10.1046/j.1365-2125.2003.02027.x. [DOI] [PMC free article] [PubMed] [Google Scholar]
- Di L., et al. A novel relay method for determining low-clearance values. Drug Metab. Dispos. 2012;40:1860–1865. doi: 10.1124/dmd.112.046425. [DOI] [PubMed] [Google Scholar]
- Vicini P., van der Graaf P.H. Systems pharmacology for drug discovery and development: paradigm shift or flash in the pan. Clin. Pharmacol. Ther. 2013;93:379–381. doi: 10.1038/clpt.2013.40. [DOI] [PubMed] [Google Scholar]
- Shah D.K., Betts A.M. Towards a platform PBPK model to characterize the plasma and tissue disposition of monoclonal antibodies in preclinical species and human. J. Pharmacokinet. Pharmacodyn. 2012;39:67–86. doi: 10.1007/s10928-011-9232-2. [DOI] [PubMed] [Google Scholar]
- Mandic Z., Gabelica V. Ionization, lipophilicity and solubility properties of repaglinide. J. Pharm. Biomed. Anal. 2006;41:866–871. doi: 10.1016/j.jpba.2006.01.056. [DOI] [PubMed] [Google Scholar]
- Hatorp V., Walther K.H., Christensen M.S., Haug-Pihale G. Single-dose pharmacokinetics of repaglinide in subjects with chronic liver disease. J. Clin. Pharmacol. 2000;40:142–152. doi: 10.1177/00912700022008793. [DOI] [PubMed] [Google Scholar]
- van Heiningen P.N., et al. Absorption, metabolism and excretion of a single oral dose of (14)C-repaglinide during repaglinide multiple dosing. Eur. J. Clin. Pharmacol. 1999;55:521–525. doi: 10.1007/s002280050667. [DOI] [PubMed] [Google Scholar]
- Kajosaari L.I., Laitila J., Neuvonen P.J., Backman J.T. Metabolism of repaglinide by CYP2C8 and CYP3A4 in vitro: effect of fibrates and rifampicin. Basic Clin. Pharmacol. Toxicol. 2005;97:249–256. doi: 10.1111/j.1742-7843.2005.pto_157.x. [DOI] [PubMed] [Google Scholar]
- Gertz M., Harrison A., Houston J.B., Galetin A. Prediction of human intestinal first-pass metabolism of 25 CYP3A substrates from in vitro clearance and permeability data. Drug Metab. Dispos. 2010;38:1147–1158. doi: 10.1124/dmd.110.032649. [DOI] [PubMed] [Google Scholar]
Associated Data
This section collects any data citations, data availability statements, or supplementary materials included in this article.