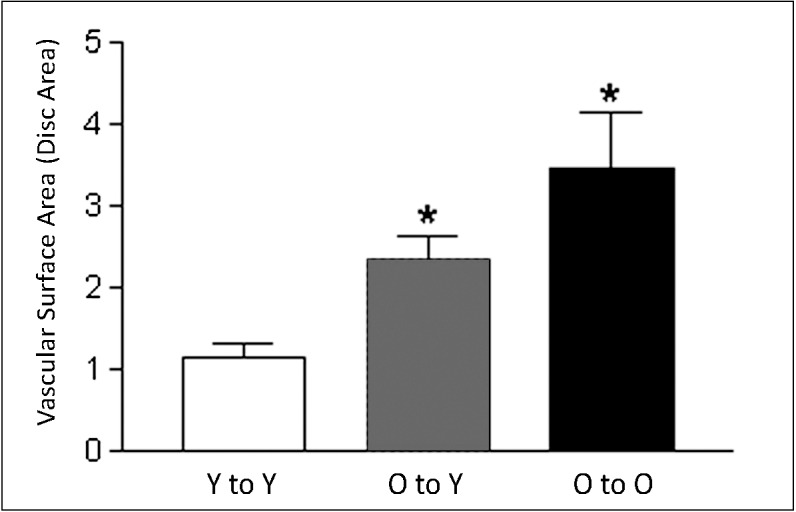
Figure 3.

Quantitative analysis of vascular surface area in experimental CNV lesions after BMT. Quantitative analysis of the vascular surface area of CNV lesions (FITC-dextran perfusion) of each group showed significant differences (asterisks) between the young-to-young compared to the old-to-young and the old-to-old groups (t-test: P < 0.003) and among all three groups (ANOVA: P < 0.0017). The differences between old-to-young and old-to-old were not statistically significant.
