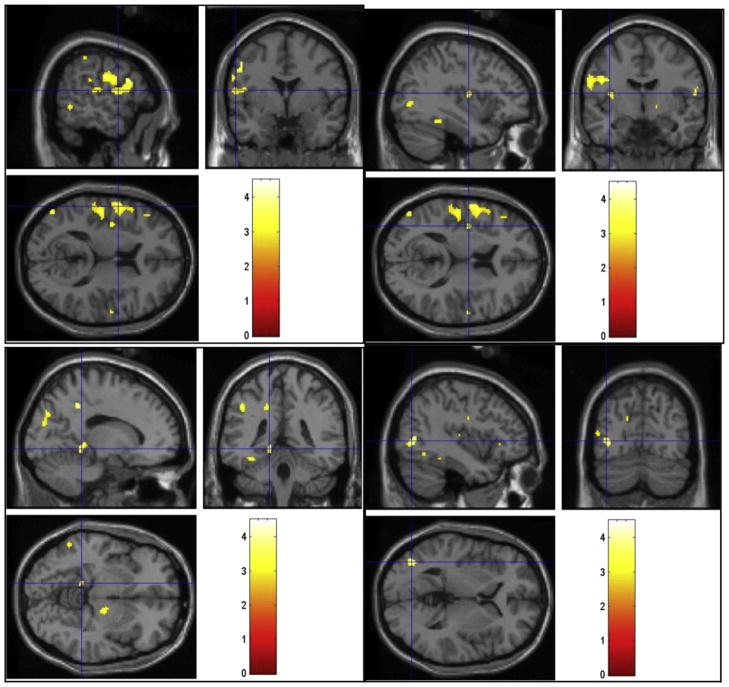
FIGURE 3.
Regions of activation that were greater in the normal group than the hypoactive sexual desire disorder group during viewing of sexual videos. Cross-hairs reflect local maxima in MNI space (x, y, z coordinates). Left precentral gyrus (top left), left insula (top right), left parahippocampal gyrus (bottom left), and left middle occipital gyrus (bottom right).

