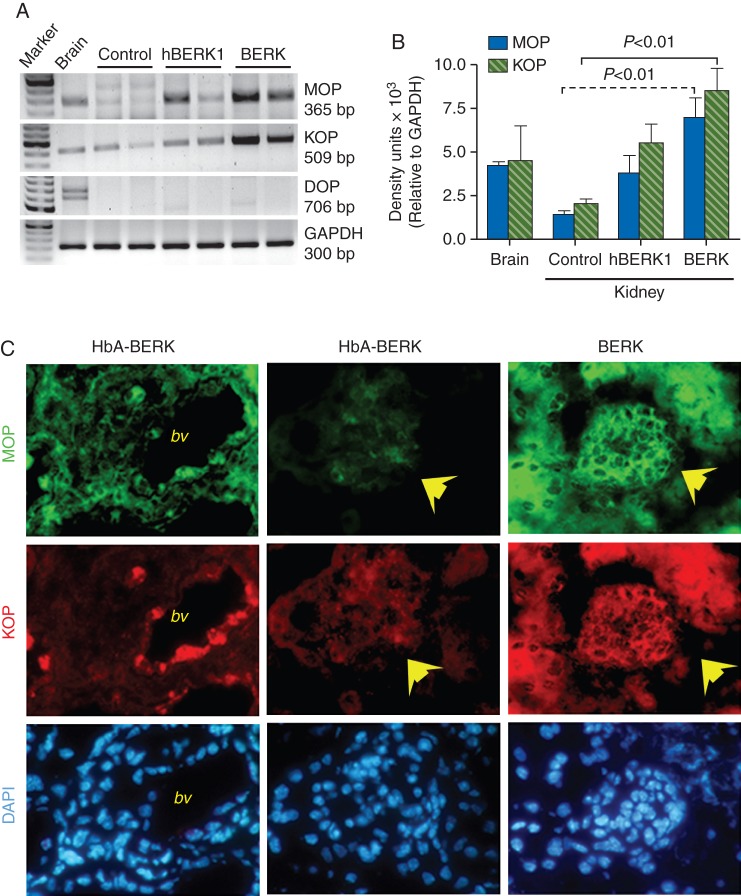
Fig 3.
Expression of MOPs and KOPs in the kidney of sickle mice. (a and b) RT–PCR analysis showing increased expression of MOP and KOP in BERK kidneys when compared with HbA-BERK. (c) Immunofluorescent staining of kidney sections showing MOP- and KOP-specific, green and red fluorescence, and 4′, 6-Diamidino-2-phenyl indole-positive blue nuclei, respectively. Each column shows the respective co-staining in the same field of view. The first column shows strong immunoreactivity (ir) of MOP and KOP on the large vessels in HbA-BERK mice kidney. Glomerular and epithelial regions of the HbA-BERK kidney do not show appreciable MOP-ir or KOP-ir (yellow arrows, middle column). BERK kidneys exhibit strong MOP-ir and KOP-ir in glomerular and epithelial cells (yellow arrows). n=5, 7, and 6 for HbA-BERK, hBERK1, and BERK, respectively. bv, blood vessels.

