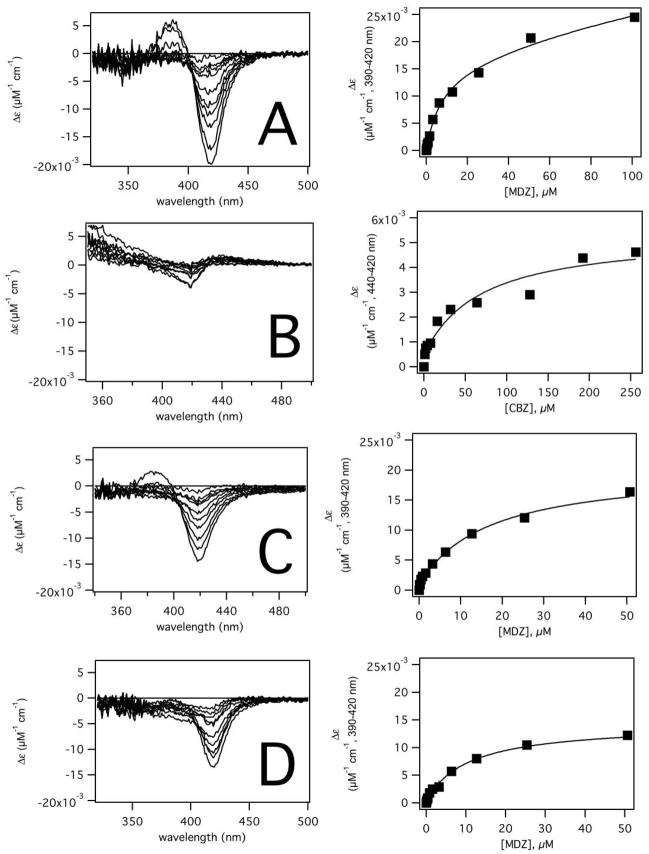
Figure 4. Absorbance difference of recombinant CYP3A4 in the presence of MDZ and CBZ.
The left and right panels show changes in the UV-visible of the CYP3A4 in the presence of A) MDZ, B) CBZ, C) MDZ and 120 μM CBZ and D) MDZ and 240 μM CBZ. The panels on the left show the absorbance difference and the panels on the right show the amplitudes (solid squares) and fits. The titration curves of A), C) and D) were simulated and fitted using GEPASI and the model in Scheme 2. The titration curve of B) was fit to eq 3.

