
Figure 6. Fitting of NMR Spectrum of 260 μM MDZ and 260 μM CBZ in the presence of 1 μM of reduced recombinant CYP3A4.
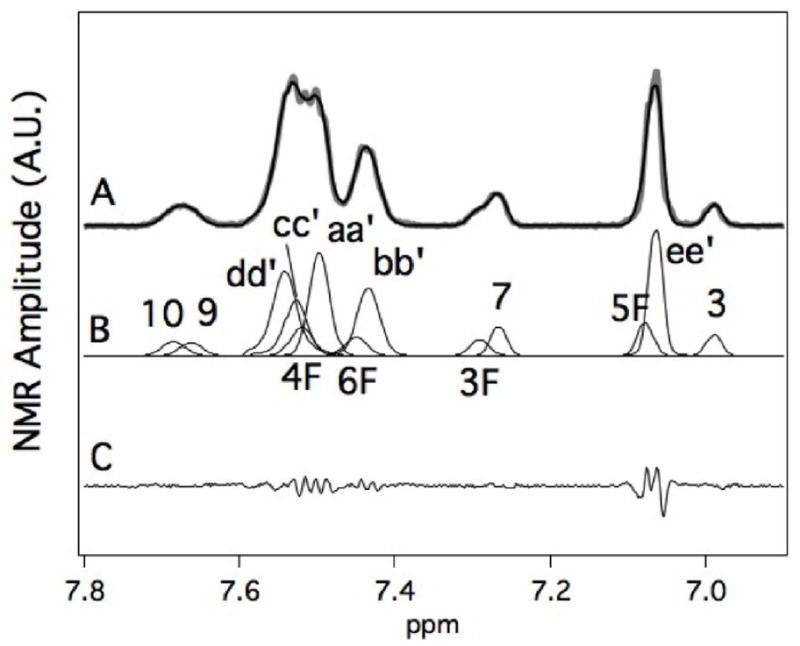
A) NMR spectrum (gray line) and the simulated fit (black line) of the spectrum. B) Simulations of the individual NMR peakes that comprise the CBZ and MDZ spectra. The numbering and lettering correspond to Scheme 1. C) Residual between the simulated fit and the NMR spectrum. The NMR assignments are based on NMR peak fitting of CBZ and MDZ with 1 μM CYP3A4 from Figure 5.