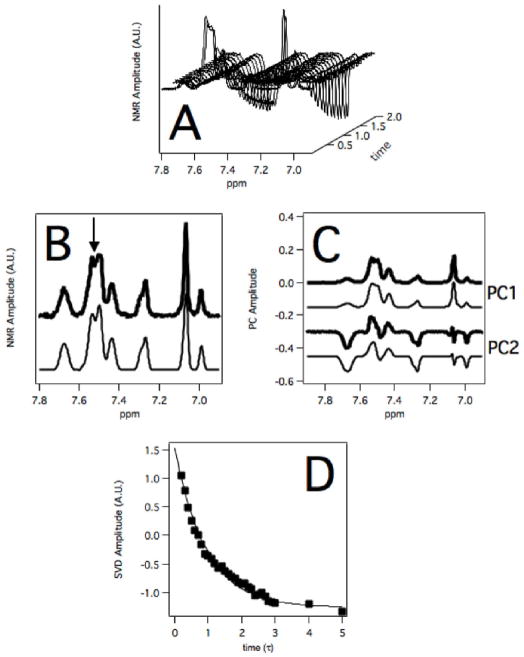
Figure 7. NMR inversion recovery experiment of 260 μM MDZ and CBZ in the presence of 1 μM recombinant CYP3A4.
A) Waterfall plot of NMR spectra of 260 μM MDZ and CBZ as a function of inversion recovery time. B) NMR spectrum (thick black line) from A) and least squares fit (thin black line) at an inversion recovery time of 1 sec with an arrow showing the position of the 4F proton peak. C) Experimentally-determined (thick black line) and simulated (thin black line) first (PC1) and second principal components (PC2) of the NMR relaxation spectra. D) SVD analysis of the inversion recovery of proton peak 4F (closed squares) and fit to a single exponential function (line) at the position shown by the arrow in panel B.

