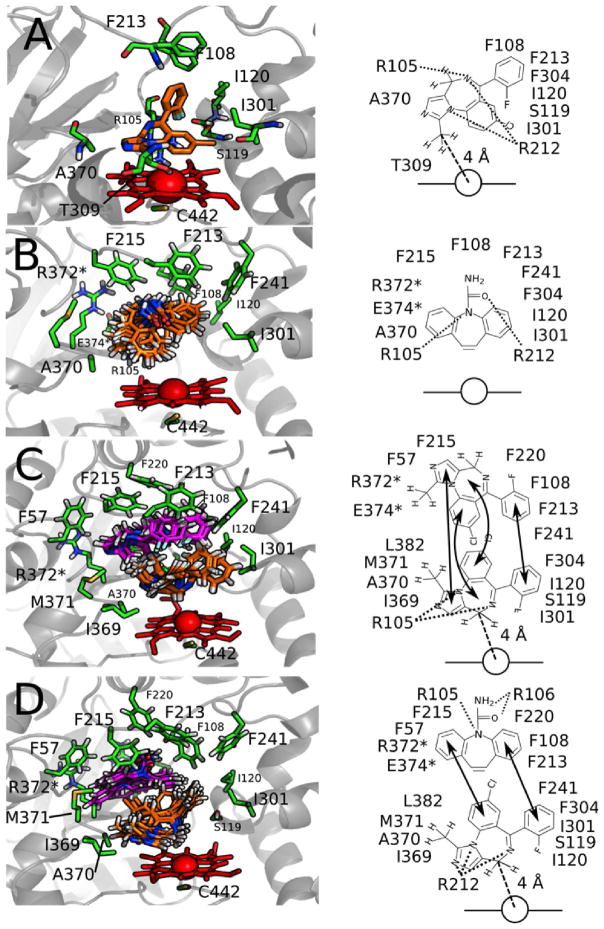
Figure 8. Distance-restrained models of CYP3A4 with A) MDZ, B) CBZ, C) 2 MDZ and D) MDZ and CBZ in the active site of CYP3A4.
The left panels show stick models of the ligand, interacting residues (green) and the heme (red) with a cartoon (gray) representation of CYP3A4 in the background. The carbons of the active drug (MDZ or CBZ) are colored orange, while the carbons of the effector drug are colored magenta. When applicable to a specific model, R212, F304 and T309 are hidden for clarity. Cartoons of these panels are shown on the right with the heme as a line and a circle. The arrows denote interactions between active and effector drugs. Dotted lines indicate hydrogen bonds and arrows indicate interactions between molecules. Dashed lines with labeled distances show the average distance between the carbon at the 1′ or 4 positions of MDZ, and the heme iron.

