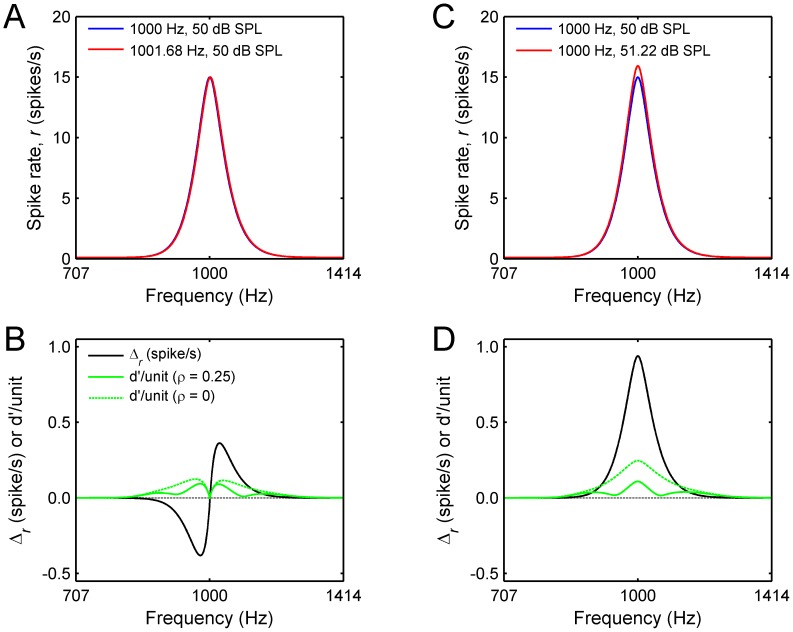
Figure 2. Population responses evoked by tones differing in frequency or intensity.
A. Population responses evoked by two tones differing slightly in frequency. Blue: mean spike rate as function of BF for a 1000 Hz, 50 dB SPL pure tone. Red: mean spike rate as function of BF for a 1001.68 Hz, 50 dB SPL pure tone. B. Spike-rate difference (Δr) and d′/unit as a function of BF. The spike-rate difference was obtained by subtracting the mean spike rate evoked by the higher-frequency stimulus (red curve in panel A) from the spike rate evoked by the lower-frequency stimulus (blue curve). d′/unit was computed as described in Experimental Procedures. C. Population responses evoked by two tones differing slightly in intensity. Blue: mean spike rate as function of BF for a 1000 Hz, 50 dB SPL pure tone. Red: mean spike rate as function of BF for 1000 Hz, 51.22 dB SPL pure tone. D. As for panel B, but for the population responses shown in panel C.

