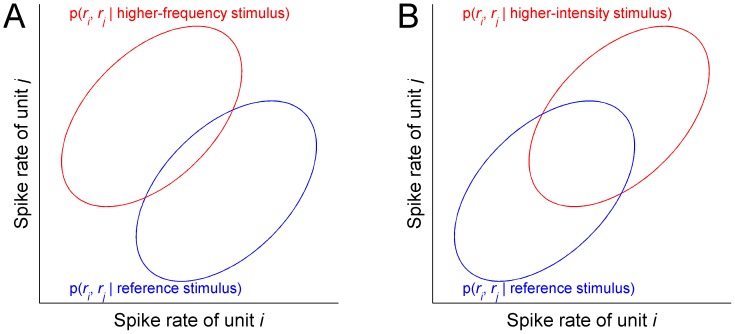
Figure 3. Schematic illustration of the impact of correlations on spike-rate distributions for frequency and intensity discrimination.
A. Horizontal slices across spike-rate distributions evoked by two stimuli differing in frequency in two units with BFs below and above the reference-stimulus frequency. The spike rate of the unit (i) with BF lower than the reference frequency is plotted along the x-axis; the spike rate of the unit (j) with BF higher than the reference frequency is plotted along the y-axis. Blue: horizontal slice across the spike-rate distribution for the reference tone (1000 Hz, 50 dB SPL); red: horizontal slice across the spike-rate distribution for the higher-frequency tone. B. Same as A, but for an intensity change.

