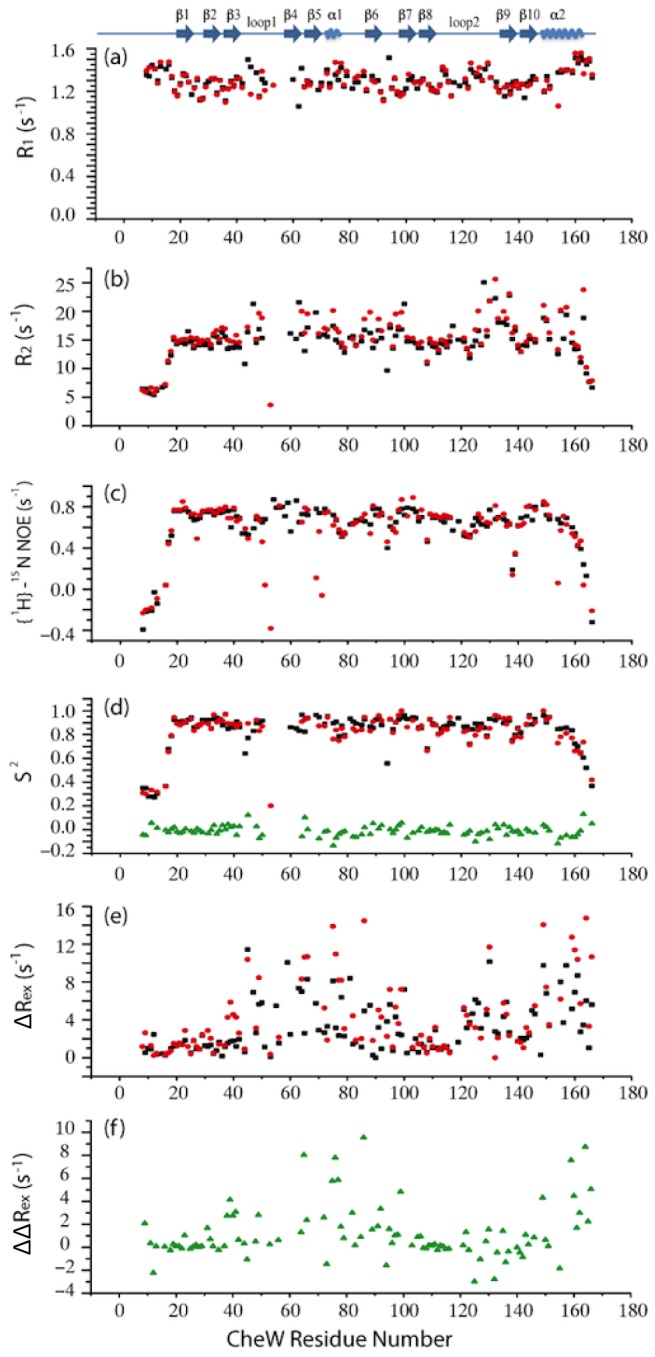
Figure 4. Effects of the mutation R62A on the global and local backbone dynamics of CheW.

Backbone amide 15N relaxation parameters for CheW vs. residue number are shown. The black squares represent wild-type CheW, the red circles represent R62A mutant, and the green triangles represent the difference between these two constructs. Approximate location of secondary structural elements is shown at the top: (a) the longitudinal relaxation rate R1; (b) the transverse relaxation rate R2; (c) 1H-15N NOE; (d) the extracted order parameter S2 (e) the differences phenomenological transverse relaxation rate constant ΔRex = Rex(20 ms)−Rex(1 ms); (f) the differences between the ΔRex in (e) ΔRex(R62A)−ΔRex(WT).
