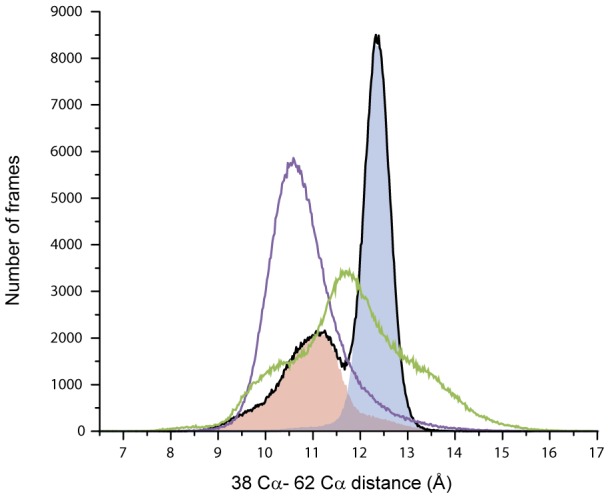
Figure 6. Histogram of the distance between alpha carbon from residues in position 38 and 62 in all simulations of wild-type (black), E38A (purple) and R62A (green).

The frames of the wild-type simulations can be separated by the occurrence of salt-bridges in geometry A (blue shade) and all other interactions (red shade). The latter includes frames with geometry B and frames with no interaction between the residues Arg62 and Glu38. The salt-bridge in geometry A is solely responsible for the peak of stability of alpha carbon distance in 12.3±0.3 Å. Both mutants show an increase in instability (broader peaks) with respect to the wild-type salt-bridge with geometry A (blue shade).
