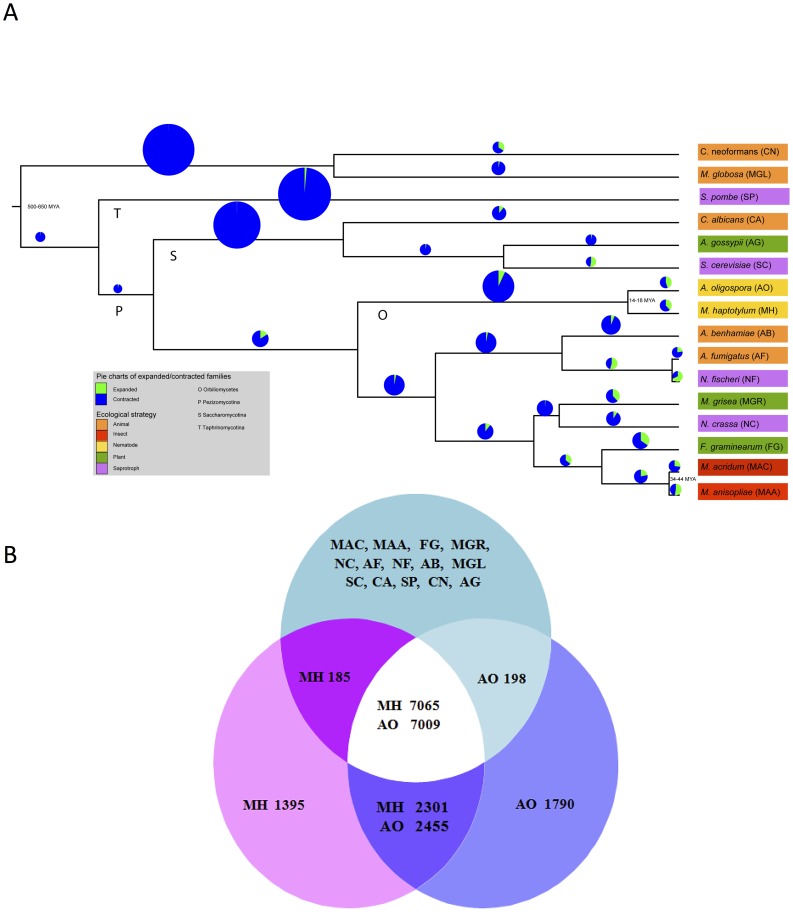
Figure 2. Gene family expansions, contractions and lineage-specific proteins of the nematode-trapping fungi M. haptotylum and A. oligospora.
(A) Rooted maximum likelihood tree constructed from 602 single copy orthologous proteins using the Dayhoff amino acid substitution model showing evolutionary relationships of 16 fungal species. Branches labeled with letters show the taxonomic classification O: Orbiliomycetes, P: Pezizomycotina, S: Saccharomycotina, T: Taphrinomycotina. The bootstrap support values were 100 on all branches. Pie charts based on CAFE analysis of 13,402 orthoMCL gene families indicate expanded and contracted gene families for each branch in the phylogenetic tree. The size of each pie chart is proportional to the total number of gene families that have either expanded or contracted (Figure S3). (B) Venn diagram of the predicted proteins in M. haptotylum and A. oligospora versus those of 14 other fungal species. The slight difference in number of genes between M. haptotylum and A. oligospora in each category is due to different gene copy numbers.

