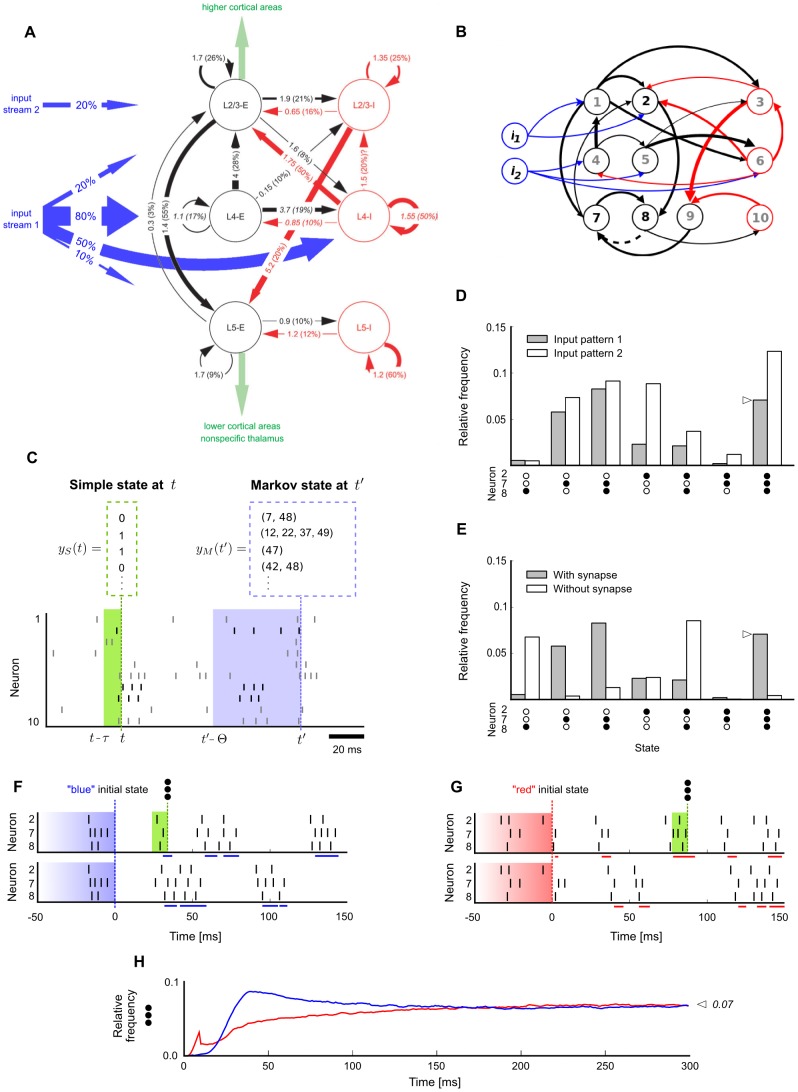
Figure 1. Network states and stationary distributions of network states in a cortical microcircuit model.
A. Data-based cortical microcircuit template from Cereb. Cortex (2007) 17: 149-162 [30];  reprinted by permission of the authors and Oxford University Press. B. A small instantiation of this model consisting of 10 network neurons
  and 2 additional input neurons
  . Neurons are colored by type (blue:input, black:excitatory, red:inhibitory). Line width represents synaptic efficacy. The synapse from neuron 8 to 7 is removed for the simulation described in E. C. Notions of network state considered in this article. Markov states are defined by the exact timing of all recent spikes within some time window
  , shown here for
  . Simple states only record which neurons fired recently (0 = no spike, 1 = at least one spike within a short window
  , with
  throughout this figure). D. Empirically measured stationary distribution of simple network states. Shown is the marginal distribution
  for a subset of three neurons 2,7,8 (their spikes are shown in C in black), under two different input conditions (input pattern 1:
  firing at
  and
and  at
at  , input pattern 2:
  at
at  and
and  at
at  ). The distribution for each input condition was obtained by measuring the relative time spent in each of the simple states (0,0,0), …, (1,1,1) in a single long trial (
 ). The zero state (0,0,0) is not shown. E. Effect of removing one synapse, from neuron 8 to neuron 7, on the stationary distribution of network states (input pattern 1 was presented). F. Illustration of trial-to-trial variability in the small cortical microcircuit (input pattern 1). Two trials starting from identical initial network states
  are shown. Blue bars at the bottom of each trial mark periods where the subnetwork of neurons 2,7,8 was in simple state (1,1,1) at this time
  . Note that the “blue” initial Markov state is shown only partially: it is actually longer and comprises all neurons in the network (as in panel C, but with
  ). G. Two trials starting from a different (“red”) initial network state. Red bars denote periods of state (1,1,1) for “red” trials. H. Convergence to the stationary distribution
  in this small cortical microcircuit is fast and independent of the initial state: This is illustrated for the relative frequency of simple state (1,1,1) within the first
  after input onset. The blue/red line shows the relative frequency of simple state (1,1,1) at each time
  estimated from many (
 ) “blue”/“red” trials. The relative frequency of simple state (1,1,1) rapidly converges to its stationary value denoted by the symbol
  (marked also in panels D and E). The relative frequency converges to the same value regardless of the initial state (blue/red).

