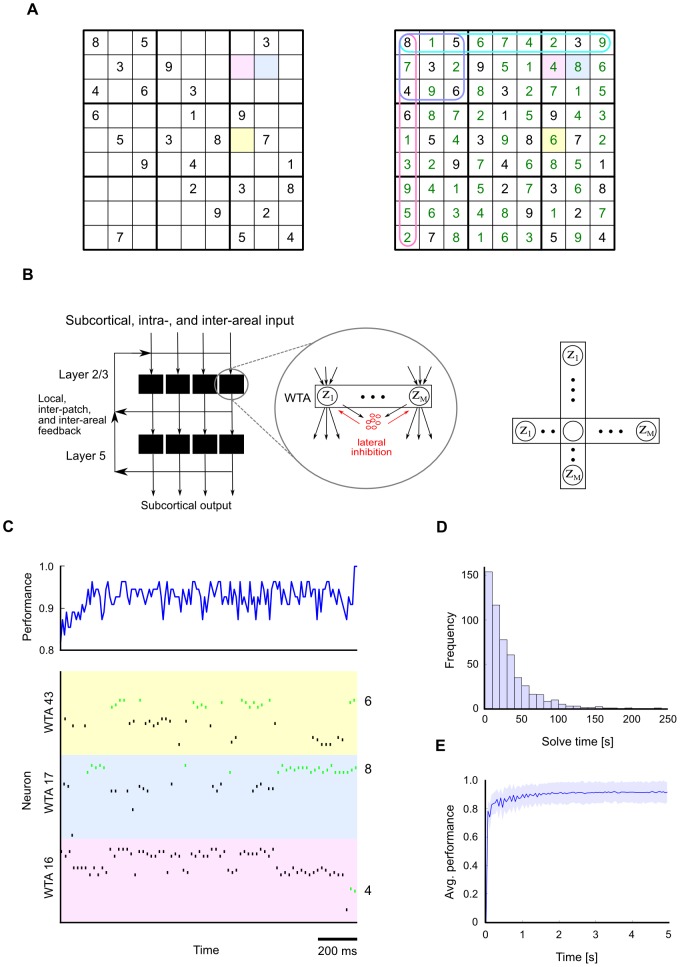
Figure 5. Solving Sudoku, a constraint satisfaction problem, through structured interactions between stochastically firing excitatory and inhibitory neurons.
A. A “hard” Sudoku puzzle with 26 given numbers (left). The solution (right) is defined uniquely by the set of givens and the additional constraints that each digit must appear only once in each row, column and 3×3 subgrid. B. An implementation of the constraints of the Sudoku game in a spiking neural network  consists of overlapping WTA circuits. WTA circuits are ubiquitous connection motifs in cortical circuits [29]. A WTA circuit can be modeled by a set of
  stochastically spiking output neurons
  that are subject to lateral inhibition (left). The same pyramidal cell can be part of several such WTA motifs (right). In the Sudoku example, each digit in a Sudoku field is associated with four pyramidal cells which vote for this digit when they emit a spike. Each such pyramidal cell participates in four WTA motifs, corresponding to the constraints that only one digit can be active in each Sudoku field, and that a digit can appear only once in each row, column and 3×3 subgrid. C. A typical network run is shown during the last
  before the correct solution was found to the Sudoku from panel A (the total solve time was approximately
  in this run, see panel D for statistics of solve times). The network performance (fraction of cells with correct values) over time is shown at the top. The spiking activity is shown for 3 (out of the 81) WTA motifs associated with the 3 colored Sudoku fields in A and B. In each of these WTA motifs there are 36 pyramidal cells (9 digits and 4 pyramidal cells for each digit). Spikes are colored green for those neurons which code for the correct digit in each Sudoku field (6, 8 and 4 in the example). D. Histogram of solve times (the first time the correct solution was found) for the Sudoku from panel A. Statistics were obtained from 1000 independent runs. The sample mean is
  . E. Average network performance for this Sudoku converges quickly during the first five seconds to a value of
  , corresponding to
  % correctly found digits (average taken over 1000 runs; shaded area:
  standard deviations). Thereafter, from all possible
  configurations the network spends most time in good approximate solutions. The correct solution occurs particularly often, on average approximately 2% of the time (not shown).

