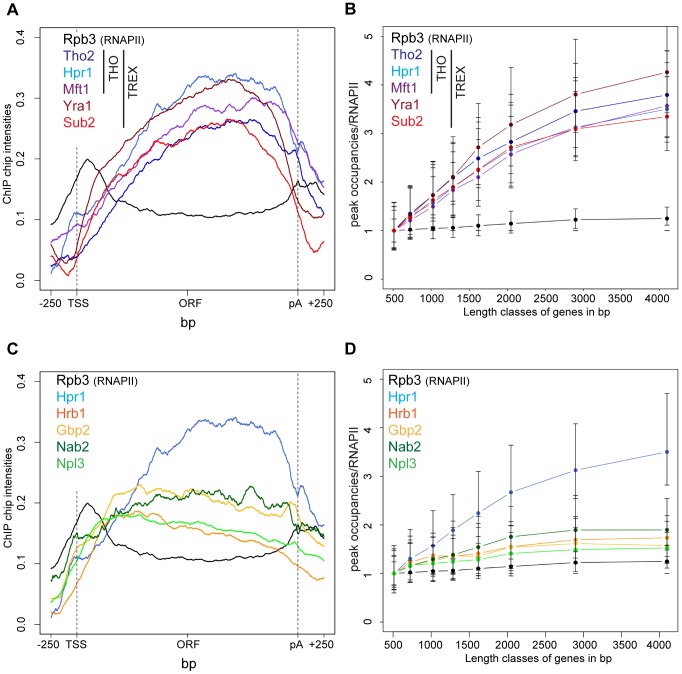
Figure 1. Recruitment of TREX increases from the 5′ to the 3′ end of the gene and with gene length.
(A) The occupancy of the TREX components increases from 5′ to 3′. Meta gene occupancy profiles of the TREX components Tho2, Hpr1, Mft1, Sub2 and Yra1. The meta gene occupancy profile of Thp2 is similar (data not shown). For comparison, the meta gene occupancy profile of RNAPII (Rpb3) is shown. (B) The peak occupancies of TREX components increase with gene length. Genes were subdivided according to the indicated length classes and the TREX occupancy for each gene in each class was normalized to RNAPII occupancy. Length classes are: A (512–723 bp), B (724–1023 bp), C (1024–1286 bp), D (1287–1617 bp), E (1618–2047 bp), F (2048–2895 bp), G (2896–4095 bp), H (4096–5793 bp). (C) Meta gene occupancy profiles of the TREX components Gbp2 and Hrb1 and the mRNA-binding proteins Nab2 und Npl3. The occupancy of these mRNA-binding proteins decreases slightly towards the 3′ end of the gene. Gene occupancy was measured with both N- and C-terminally tagged for Gbp2 to ensure that the resulting profiles were not due to epitope tagging (data not shown). For Npl3, the occupancy of TAP-Npl3 was determined since Npl3-TAP mislocalizes to the cytoplasm. The meta gene occupancy profiles of RNAPII (Rpb3) and the TREX component Hpr1 are shown for comparison. (D) Occupancy of mRNA-binding proteins increases only slightly with gene length. Graph as in (B).

