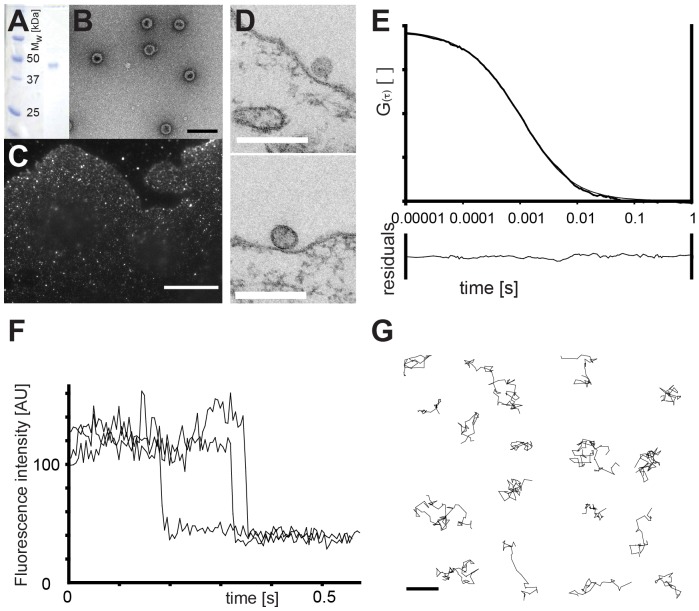
Figure 1. Preparation of SV40 virus-like particles and measurement of virus and receptor dynamics.
(A) Recombinantly expressed, purified SV40 VP1 protein analyzed by gel-electrophoresis. Left is the marker lane, the right single band represents the VP1 protein at ∼40 kDa. (B) In vitro assembled SV40 virus-like particles (VLPs) as seen by transmission electron microscopy after negative staining. Scale bar is 100 nm. (C) Fluorescence-microscopy image of Atto-565 labeled SV40 VLPs bound to CV1 cells. Scale bar is 10 µm. (D) Electron microscopy images of SV40 VLPs immediately after binding to cellular plasma membranes. Scale bars are 200 nm. (E) Top: Fluorescence correlation spectroscopy measurement of the diffusion of Atto488-labeled SV40 VLPs in buffer solution. Shown is the overlay of the average of 5 measurements of 5 seconds each and the fit with 3D free-space diffusion model. Bottom: Residuals of the fit. (F) Fluorescence-intensity traces of individual TMR-GM1 molecules at trace amounts in a DOPC supported membrane bilayer in time-lapse acquisition showing one-step photobleaching. (G) Examples of measured single molecule trajectories of TMR-GM1. Scale bar is 1 µm.

