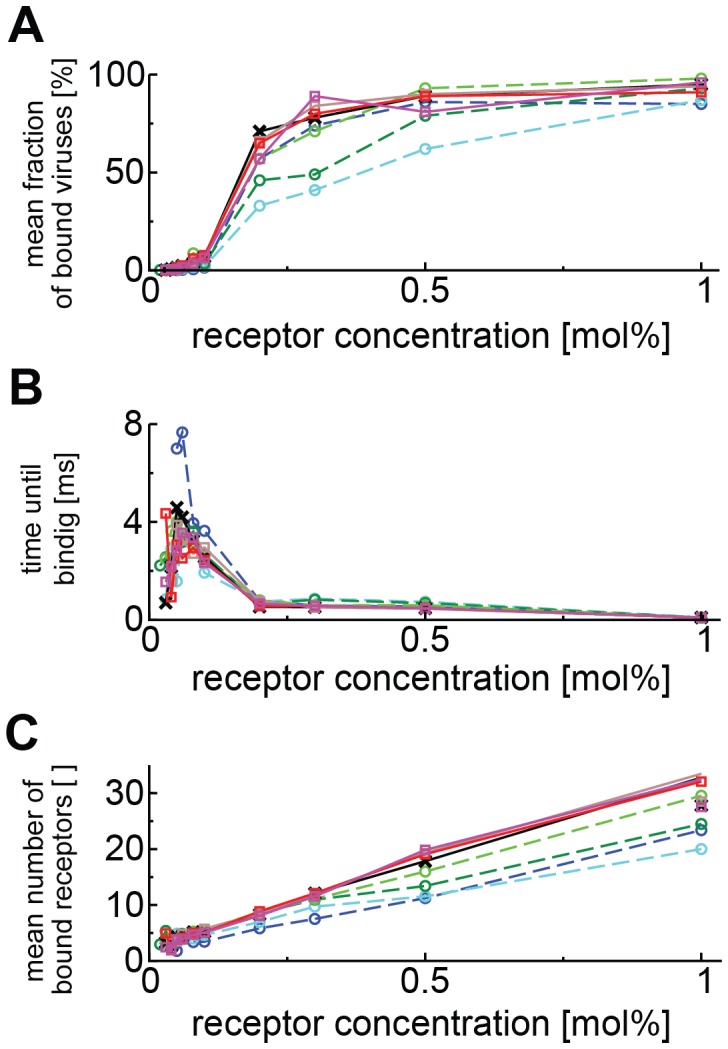
Figure 5. Influence of receptor diffusivity and concentration on viral binding.

(A) Fraction of stably bound virions vs. receptor concentration for various diffusivities of GM1 in the plane of the membrane. (B) Average time required to reach stable binding vs. receptor concentration for various diffusivities of GM1 in the plane of the membrane. (C) Mean number of bonds formed by stably bound virions for various diffusivities of GM1 in the plane of the membrane. Different lines correspond to different GM1 diffusivities: 10 µm2/s (pink), 5 µm2/s (red), 2 µm2/s (brown), 1 µm2/s (black), 0.5 µm2/s (light green), 0.2 µm2/s (green), 0.1 µm2/s (light blue), 0 µm2/s (dark blue).
