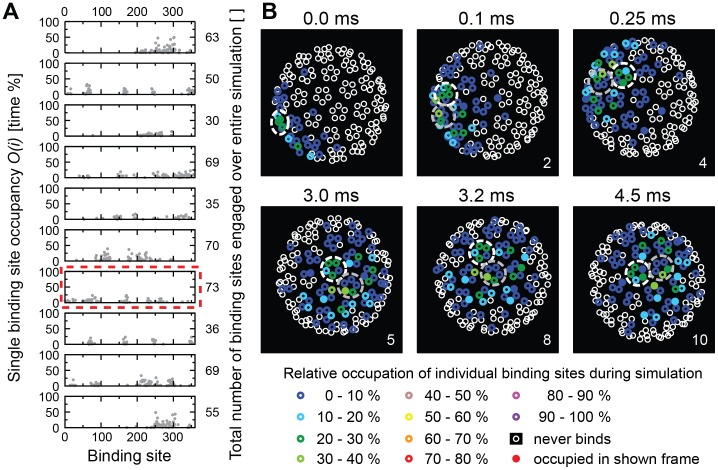
Figure 6. Occupancy of binding sites on a virion for 0.1 mol% GM1.
(A) Ten graphs showing the rates at which each of the 360 individual binding sites of a virion is occupied during an entire simulation. Only binding sites with occupancy >0 are shown. The numbers on the right indicate the total numbers of binding sites that ever engaged with a receptor during the simulation. The graph emphasized by a red dashed line is analyzed in detail in (B). (B) The panels show the viral VP1 proteins projected onto the plane of the membrane as seen from below (i.e., looking up from the membrane). The white and grey dashed circles mark two adjacent pentamers to highlight viral motion. Small circles represent VP1 protein binding-sites. Sites that were never occupied by a receptor during the simulation are indicated by open white circles. Otherwise, color encodes the overall occupancy during the simulation of each VP1 protein as indicated. Sites that were bound to a receptor at the time of taking the snapshot are represented as filled circles.

